Why this wrong word?
Lampe et al. (2024)
LING 449U, How words are built
2026-09-24
What did earlier studies ask?
Which words are hard to name? What kinds of errors occur?
- Frequency and age of acquisition: mixed findings on whether errors are more frequent or earlier learned than targets.
- Typicality: people with semantic dementia often substitute a more typical category member (Woollams et al., 2008; Woollams, 2012).
- Semantic features: words with more features can be named faster and more accurately (Taylor et al., 2012; Rabovsky et al., 2016).
But why say pelican, rather than peacock, for flamingo?
Earlier literature as reviewed in Lampe et al. 2024, pp. 19 to 22
What can a wrong word tell us?
Someone sees flamingo but says pelican.
- The activation account: the representation of pelican became more strongly activated in the mental lexicon than the representation of flamingo.
- The question: which properties of the words, and of their relationship, could explain that activation pattern?
- The approach: compare targets and errors on psycholinguistic variables such as typicality, number of semantic features, and similarity.
Patterns in naming errors can help us infer how word knowledge is represented and activated during production.
Lampe et al. 2024
Task: speeded picture naming
Show a picture → require a fast name → collect the mistakes.
- A short response deadline produces more naming errors in neurotypical speakers.
- Mirman (2011): errors often came from the target’s near semantic neighbours, more often than chance would predict.
- Lampe et al.’s next question: among possible wrong words, which semantic properties favour selection?
Being related to the target may get a word activated. What makes it win?
Moses et al. 2004; Mirman 2011, as reviewed in Lampe et al. 2024, pp. 18 to 22
Earlier evidence: neighbourhood effects
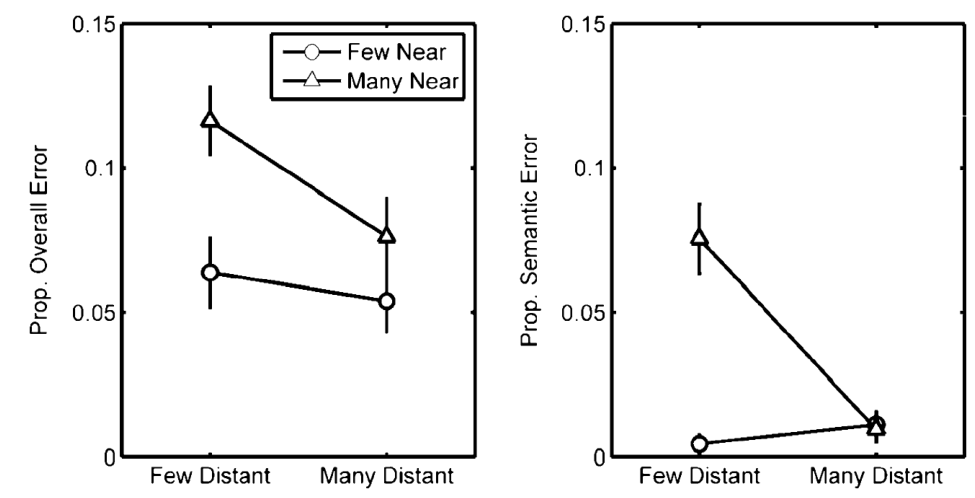
More near neighbours: more errors. More distant neighbours: fewer errors overall.
Mirman 2011, Figure 3, p. 39, original plot
The logic: compare each error with its target
Related words become active together. An error shows which alternative was selected.
| Property | Comparison | Prediction |
|---|---|---|
| Typicality | How representative is the error of its category, relative to the target? | Error > target |
| Number of features | How many semantic properties does each word have? | Error > target |
| Semantic similarity | Is the error closer to the target than the target’s near neighbours are, on average? | Error similarity > neighbour average |
Account for frequency, age of acquisition, familiarity, word length, imageability, and naming history.
Lampe et al. 2024, pp. 22 to 23, 26 to 27
Materials
- 78 participants analysed: native Australian English speakers.
- 297 colour photographs of objects, with high name agreement (>75%).
- McRae et al. (2005) norms: semantic features for calculating all three measures.
- Six presentation lists; at least two other-category pictures between pictures from the same category.
Compare real-word errors with known target names. Both words need the relevant norm data.
Lampe et al. 2024, pp. 22 to 26
Procedure: start speaking within 600 ms
First: standard naming. Then standard and speeded naming, in counterbalanced order.
Practice: picture + beep at 600 ms. Try to beat the beep.
Experimental trial:
Fixation (500 to 1000 ms) → picture (2000 ms, no beep) → speed feedback (400 ms) → blank (1000 ms)
Say the first word that comes to mind. Prioritize speed over accuracy.
Lampe et al. 2024, p. 24
Pictures
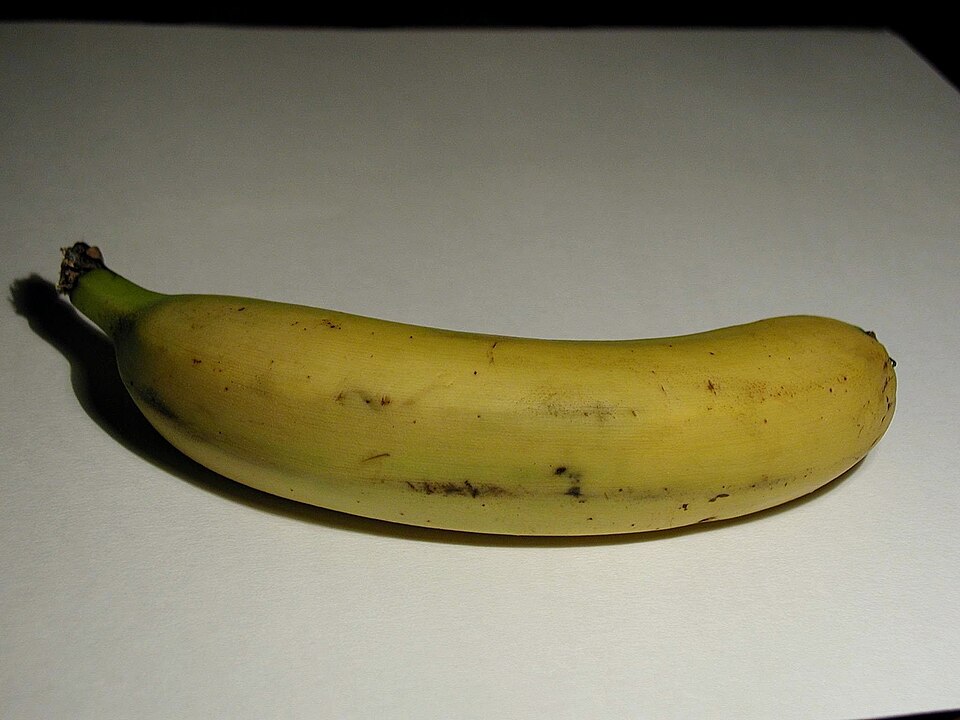
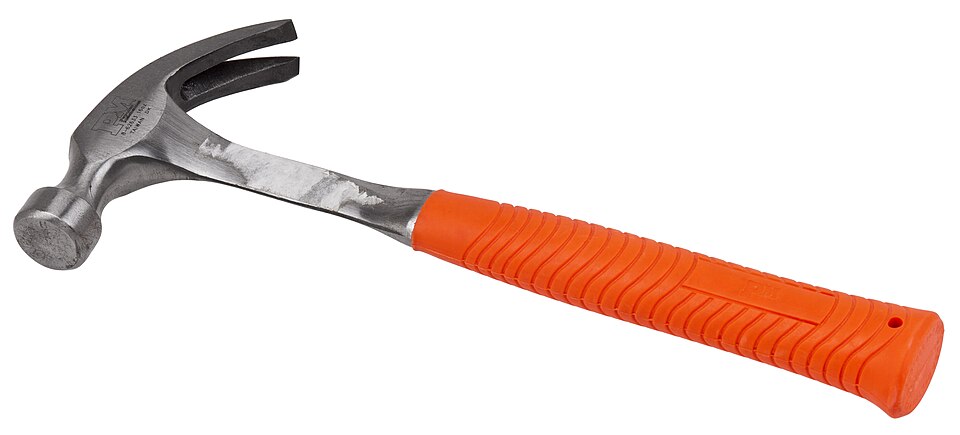
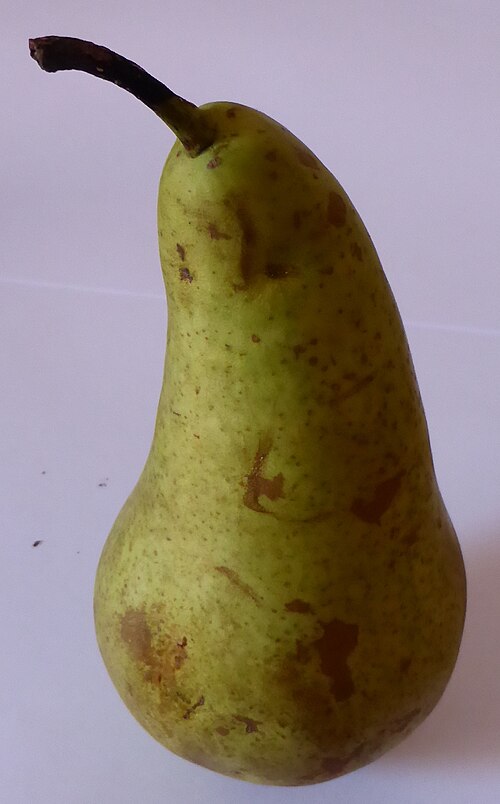
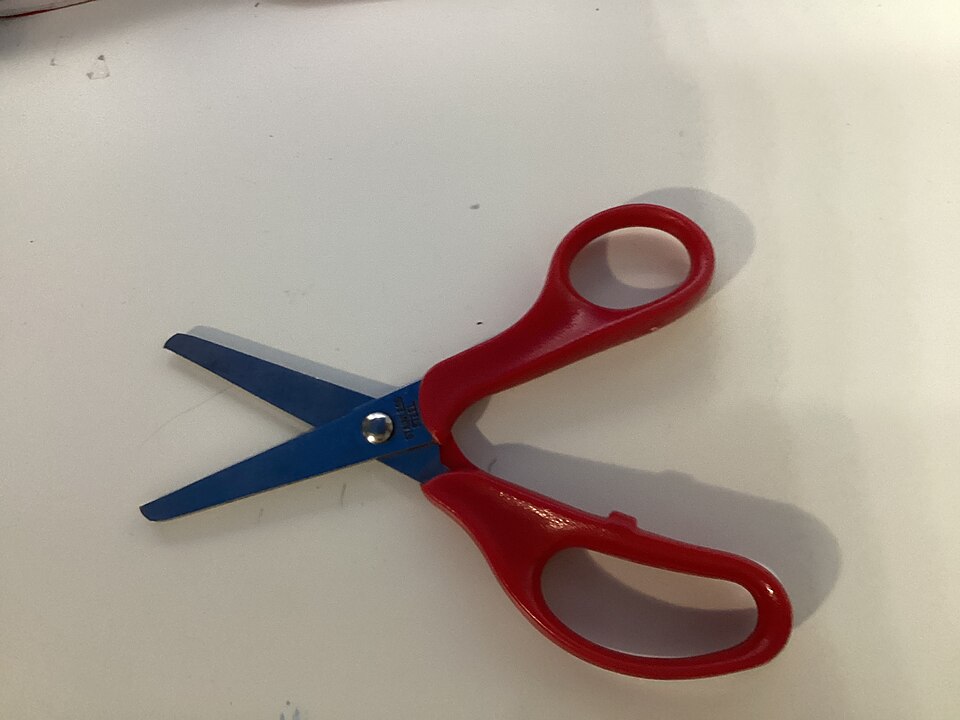
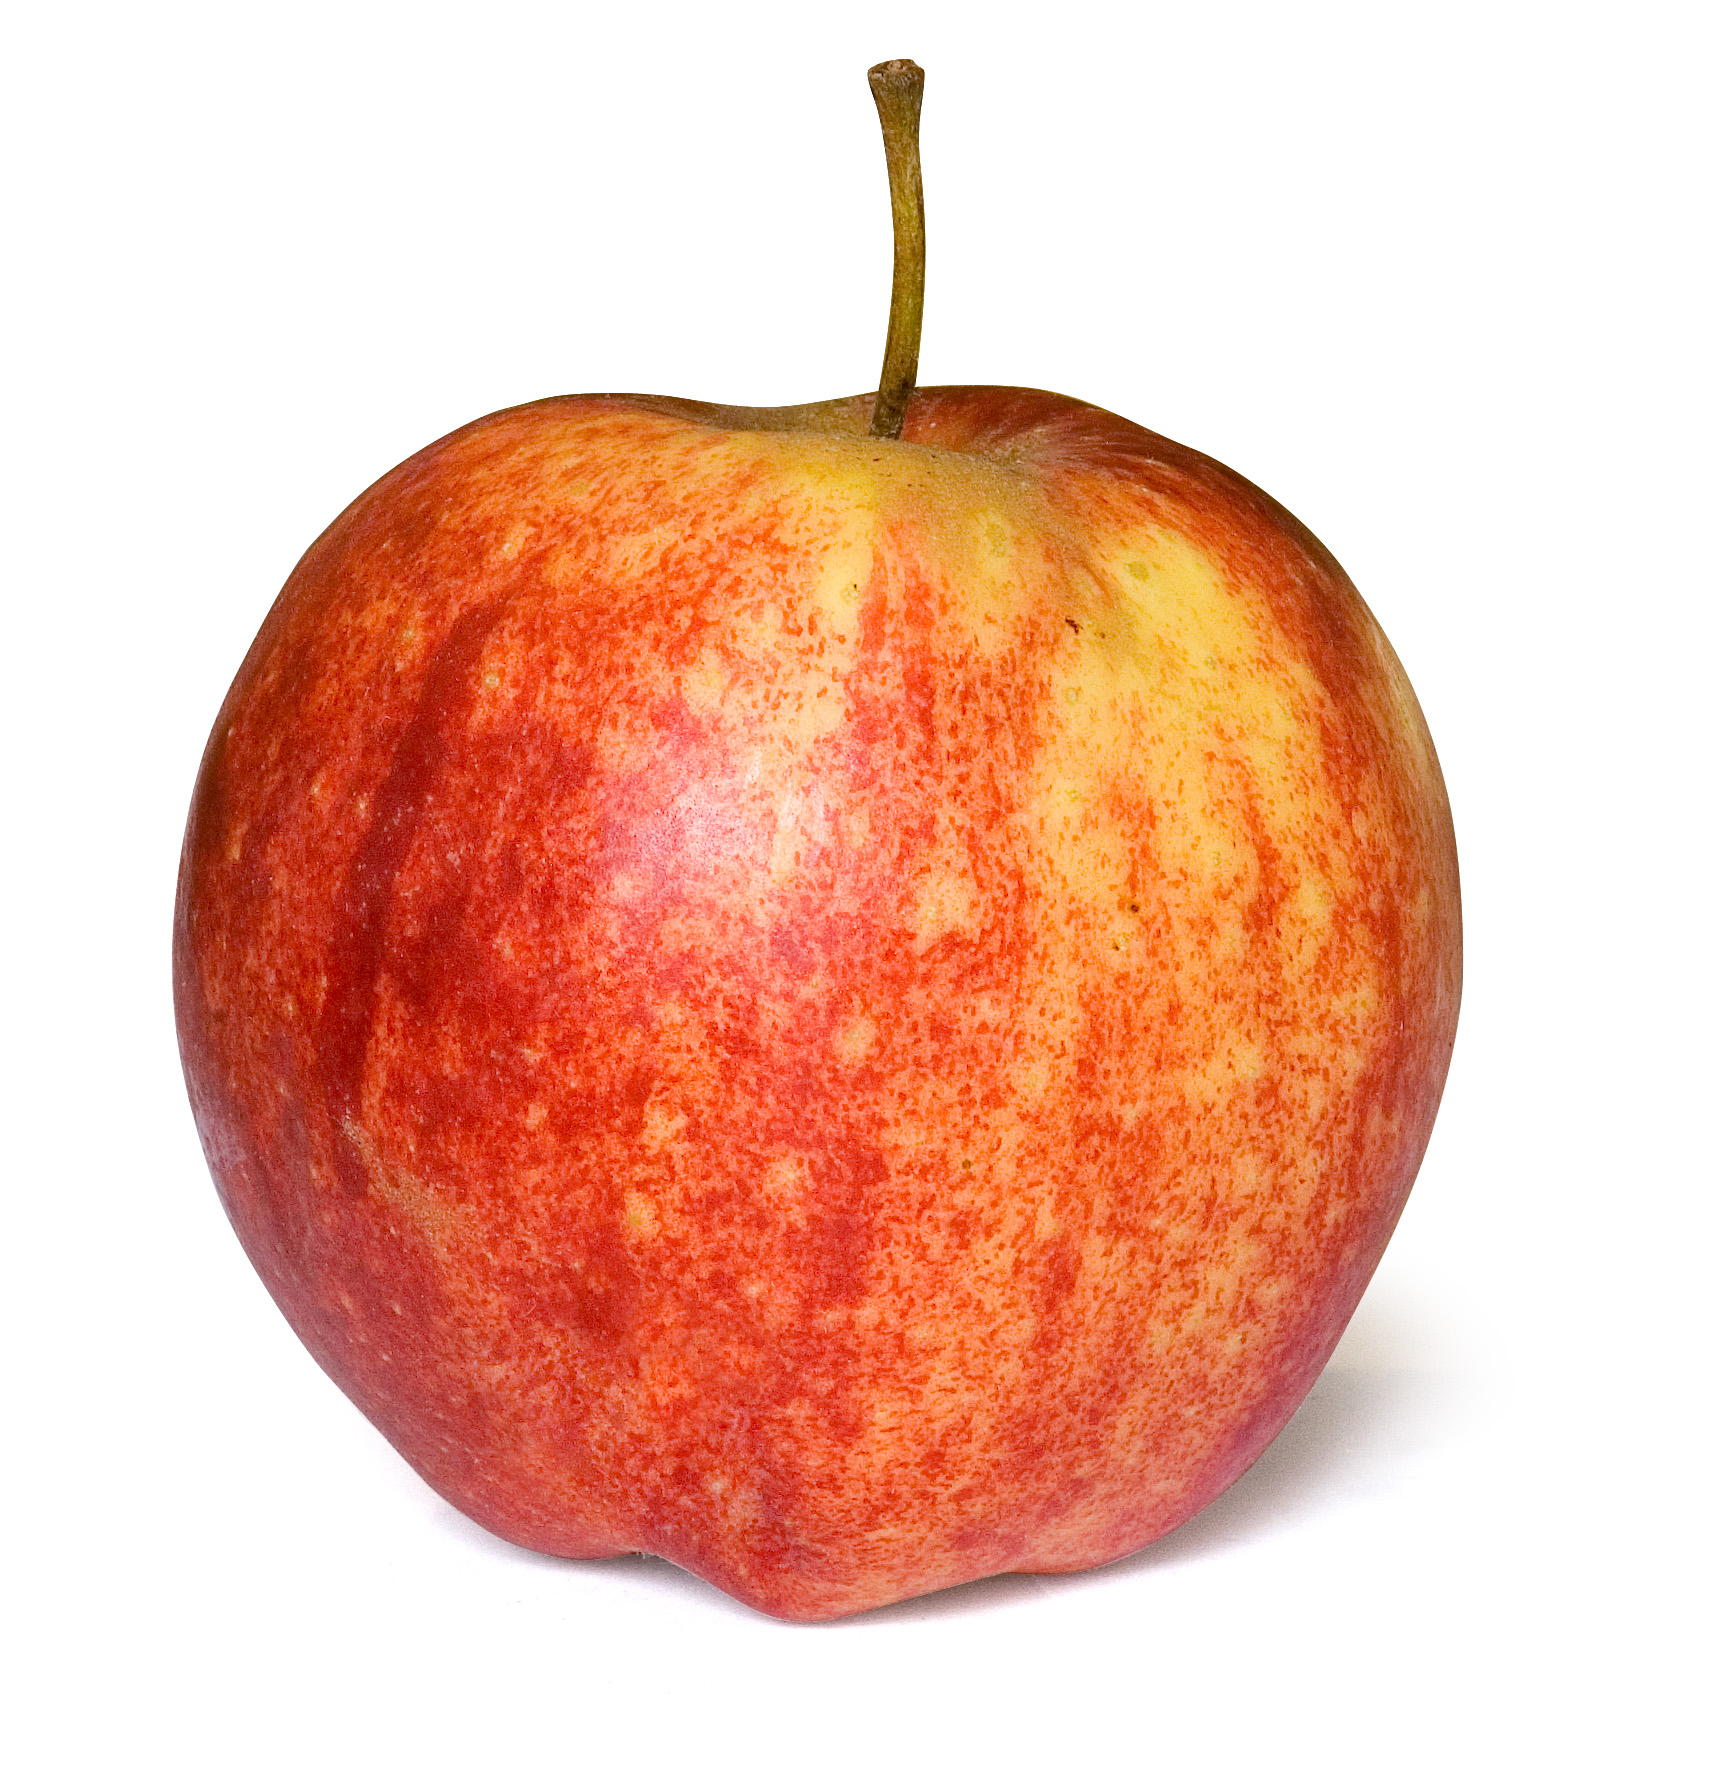
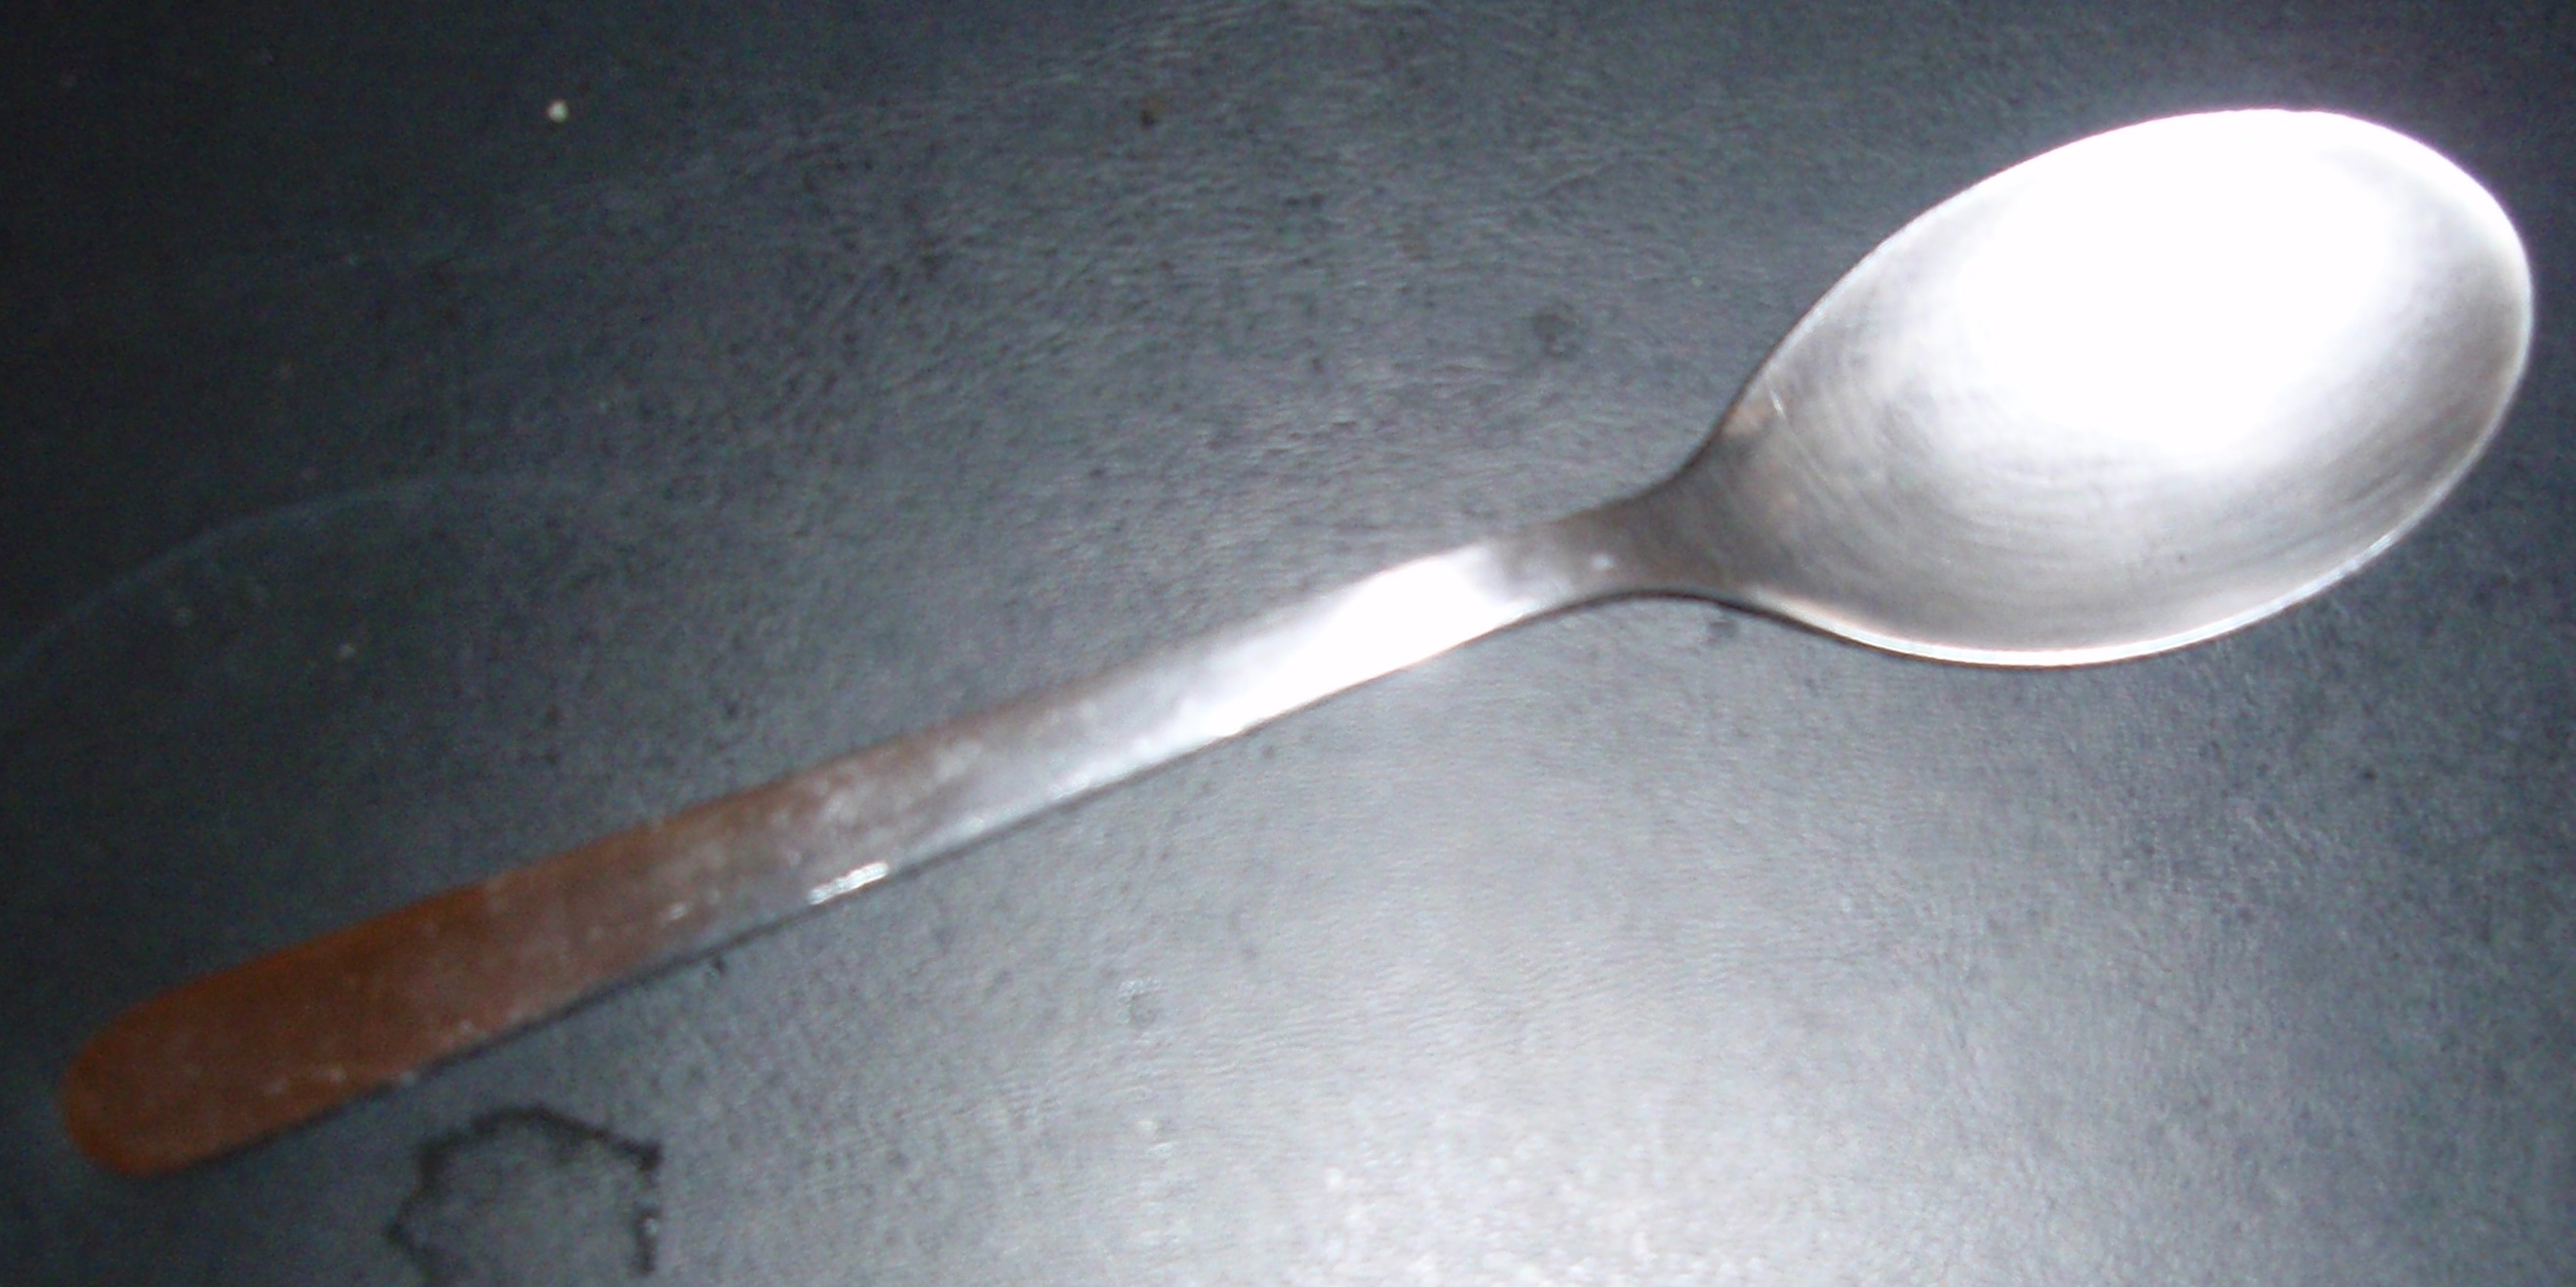
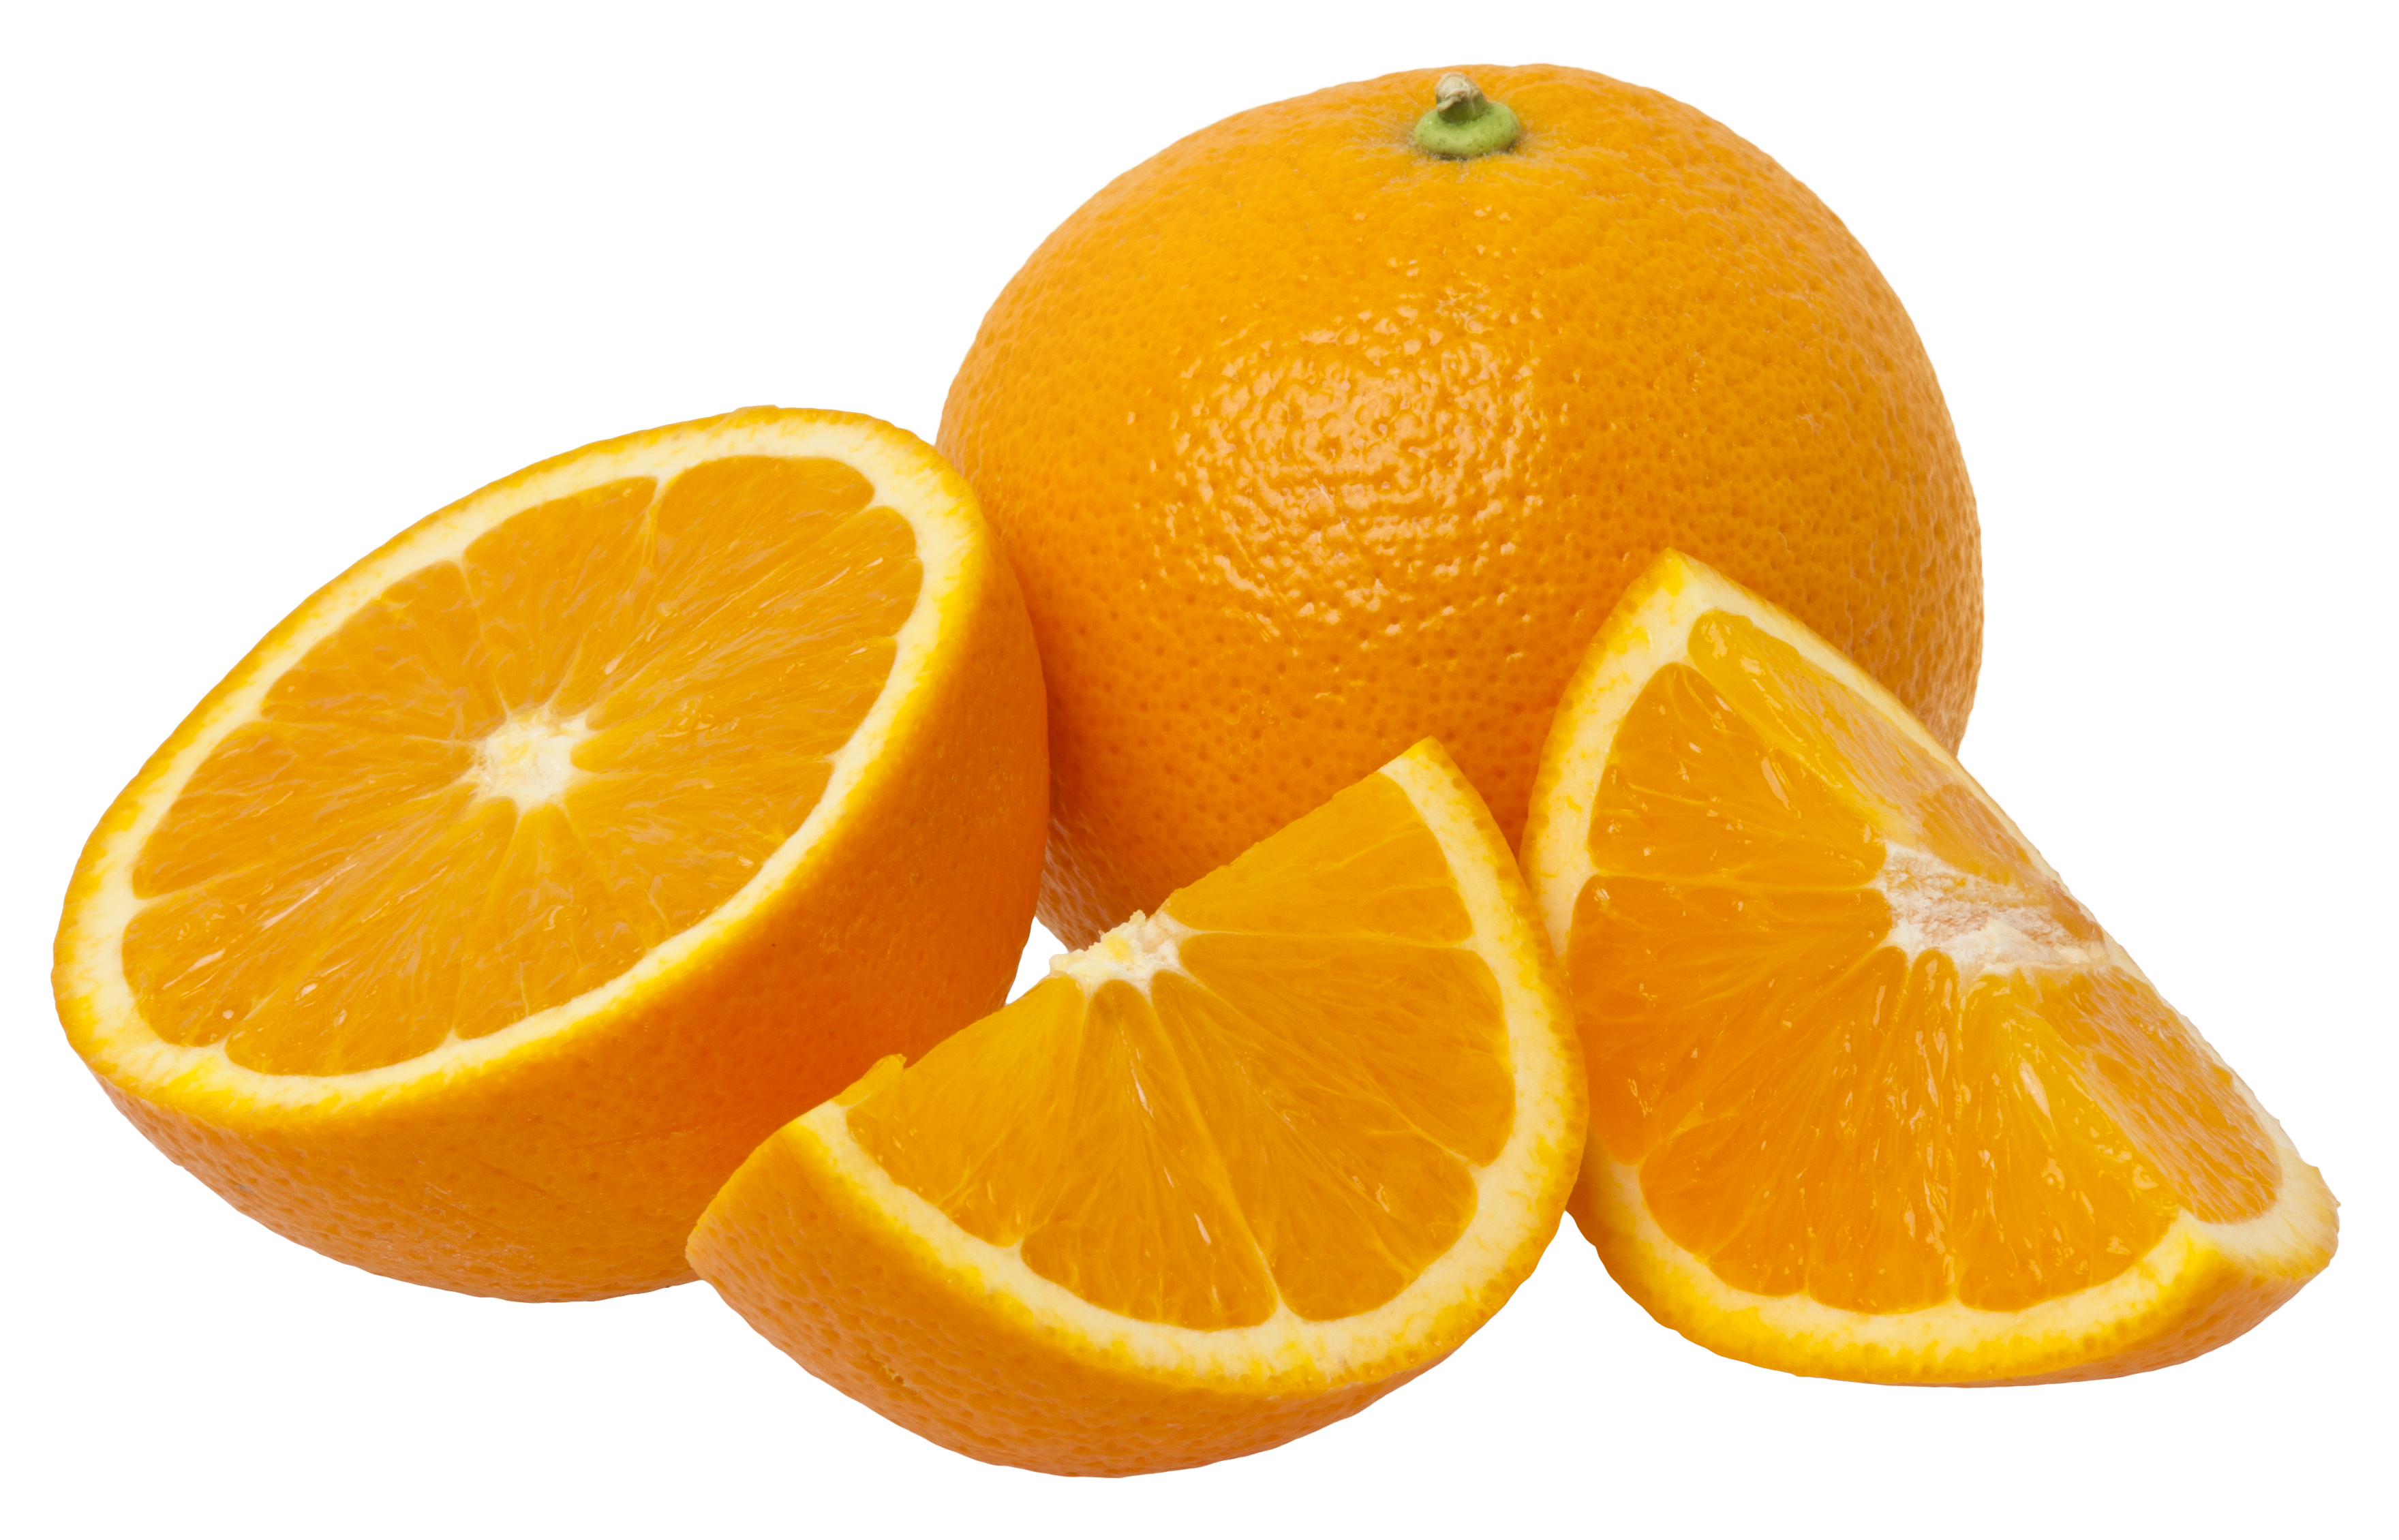
Try it: name the pictures
Say the first name that comes to mind, out loud.
- Look at the + before each picture.
- Begin speaking before the picture disappears: 600 ms.
- Keep going if you make a mistake. There are eight pictures.
Loading pictures...
Fixation 1
+
Picture 1
Blank 1
Fixation 2
+
Picture 2
Blank 2
Fixation 3
+
Picture 3
Blank 3
Fixation 4
+
Picture 4
Blank 4
Fixation 5
+
Picture 5
Blank 5
Fixation 6
+
Picture 6
Blank 6
Fixation 7
+
Picture 7
Blank 7
Fixation 8
+
Picture 8
Blank 8
What happened under time pressure?
Picture exposure and response deadline
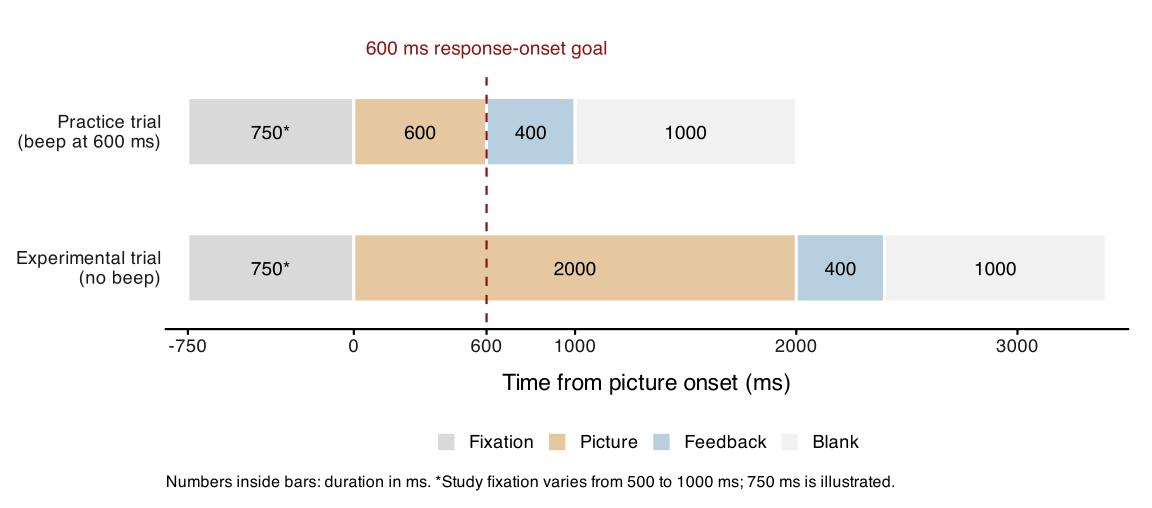
Diagram from Lampe et al. 2024, p. 24
Can we know the answer from this experiment?
Results: Table 1
| Broad category | Error type | Count | % of errors |
|---|---|---|---|
| Semantic errors | Coordinate | 1,677 | 85.30 |
| Semantic other | 92 | 4.68 | |
| Part-whole relationship | 23 | 1.17 | |
| Associate | 8 | 0.41 | |
| Superordinate | 3 | 0.15 | |
| Other errors | Unrelated | 111 | 5.65 |
| Visual | 29 | 1.48 | |
| Phonologically related word | 22 | 1.12 | |
| Compound | 1 | 0.05 | |
| Total | 1,966 | 100.00 |
Lampe et al. 2024, Table 1, p. 28; errors included in the primary analyses
What did they find?
1,966 errors in the primary analysis; 85.3% were same-category substitutions.
| Prediction | Result |
|---|---|
| More typical than the target | Supported: adjusted difference +2.52, p < .01 |
| More semantic features than the target | Supported: +0.61 features, p < .05 |
| Closer than the near-neighbour average | Not supported: similarity difference −0.06, p < .001 |
Errors were often near neighbours, but not systematically closer than the average near neighbour.
Lampe et al. 2024, pp. 28 to 30, 33 to 35; Tables 1 and 2
The distributions: typicality and features
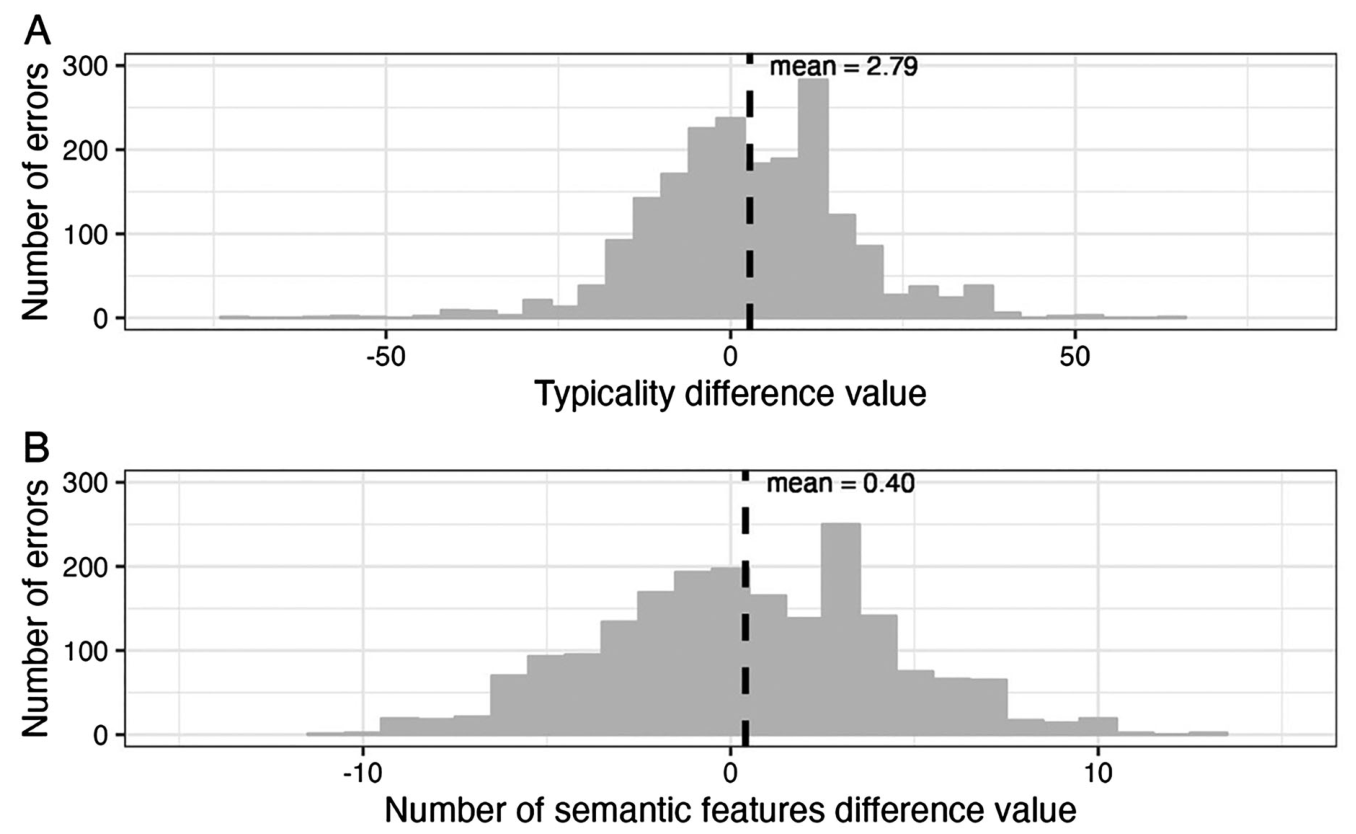
Lampe et al. 2024, Figure 1A and 1B, p. 29, original panels
Similarity: what is the comparison?
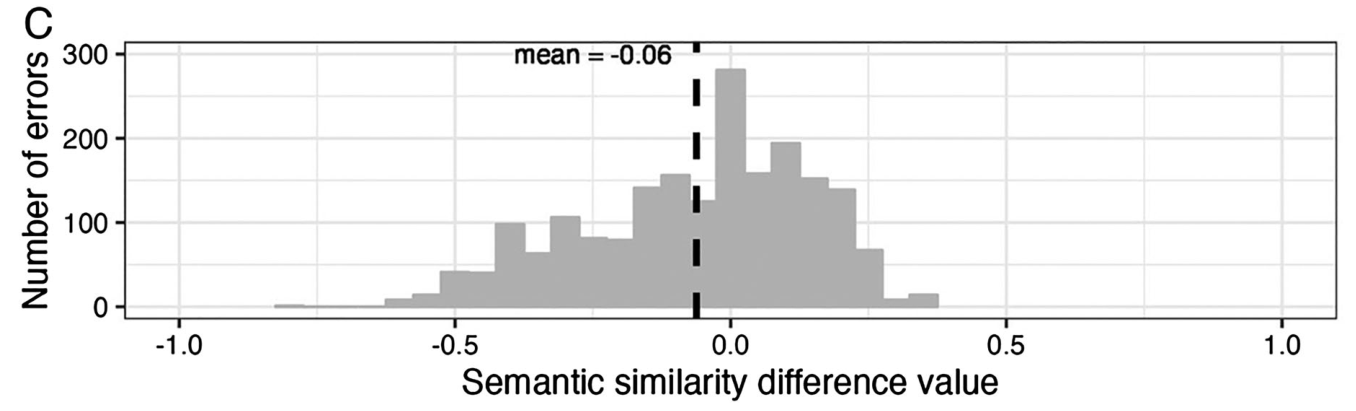
Zero: the error is as similar to the target as the average near neighbour is.
Below zero: the error is less similar than that average.
Lampe et al. 2024, Figure 1C, p. 29, original panel
Naming demo: image credits
Photographs from Wikimedia Commons, saved locally. Originals or Commons thumbnails; no content edits.
| Picture and source | Creator | License |
|---|---|---|
| Banana | Paolo Neo | Public domain |
| Hammer | Evan-Amos | Public domain |
| Pear | MartinThoma | CC0 1.0 |
| Scissors | Help e choose | CC BY-SA 4.0 |
| Apple | Amada44 | Public domain |
| Spoon | Ari Abitbol | Public domain |
| Orange | Evan-Amos | CC BY-SA 3.0 |
| Lollipop | Evan-Amos | Public domain |


Appendix: how are the measures calculated?
Start with features people listed for each word, such as has wings or flies (McRae et al., 2005).
- Typicality: for each feature, multiply the proportion of category members sharing it by the number of people who listed it for that word, then add the scores. Shared, often-mentioned features give higher typicality.
- Number of features: count the different listed properties, excluding category labels such as is a bird.
- Semantic similarity: compare two words’ feature profiles using cosine similarity. More overlap gives a higher score.
Lampe et al. 2024, p. 23; measures based on McRae et al. 2005