Reading 3: Piloting, preregistration, and collecting usable data
This reading is a selection from Experimentology: An Open Science Approach to Experimental Psychology Methods (Frank et al., 2025), prepared for LING 449U, University of Maryland, Fall 2026. The source, licence, and a statement of changes are at the end of the reading.
These excerpts follow the practical work of preparing, piloting, planning, and documenting a study.
4.2 Ethical responsibilities to research participants
Milgram’s shock experiment was just one of dozens of unethical human subjects studies that garnered the attention and anger of the public in the United States. In 1978, the US National Commission for the Protection of Human Services of Biomedical and Behavioral Research released the Belmont Report, which described protections for the rights of human subjects participating in research studies (Adashi et al. 2018). Perhaps the most important message found in the report was the notion that “investigators should not have sole responsibility for determining whether research involving human subjects fulfills ethical standards. Others, who are independent of the research, must share the responsibility.” In other words, ethical research requires both transparency and external oversight.
4.2.1 Institutional review boards
The creation of institutional review boards (IRBs) in the United States was an important result of the Belmont Report. While regulatory frameworks and standards vary across national boundaries, ethical review of research is ubiquitous across countries. In what follows, we focus on the US regulatory framework as it’s been a model for other ethical review systems, but we use the clearer label “ethics review boards” for IRBs.
An ethics board is a committee of people who review, evaluate, and monitor human subjects research to make sure that participants’ rights are protected when they participate in research (Oakes 2002). Ethics boards are local; every organization that conducts human subjects or animal research is required to have its own ethics board or to contract with an external one. If you are based at a university, yours likely has its own, and its members are probably a mix of scientists, doctors, professors, and community residents.1
When a group of researchers have a research question they are interested in pursuing with human subjects, they must receive approval from their local ethics board before beginning any data collection. The ethics board reviews each study to make sure:
A study poses no more than minimal risk to participants. This means the anticipated harm or discomfort to the participant is not greater than what would be experienced in everyday life. It is possible to perform a study that poses greater than minimal risk, but it requires additional monitoring to detect any adverse events that may occur.
Researchers obtain informed consent from participants before collecting any data. This requirement means experimenters must disclose all potential risks and benefits so that participants can make an informed decision about whether or not to participate in the study. Importantly, informed consent does not stop after participants sign a consent form. If researchers discover any new potential risks or benefits along the way, they must disclose these discoveries to all participants (see chapter 12).
Sensitive information remains confidential. Although regulatory frameworks vary, researchers typically have an obligation to their participants to protect all identifying information recorded during the study (see chapter 13).
Participants are recruited equitably and without coercion. Before ethics boards became standard, researchers often coercively recruited marginalized and vulnerable populations to test their research questions, rather than making participation in research studies voluntary and providing equitable access to the opportunity to participate.
4.2.2 Risks and benefits
Imagine that you were approached about participating in a research study at your local university. You were only told you would be paid $25 in exchange for completing an hour of cognitive tasks on a computer. Now imagine that halfway through the session, the experimenter revealed they would also need to collect a blood sample, “which should only take a couple of minutes and which will really help the research study.” Would you agree to the sample? Would you feel uncomfortable in any way?
Participants need to understand the risks and benefits of participation in an experiment before they give consent. To do otherwise compromises their autonomy (a key deontological principle). In the case of this hypothetical experiment, a new and unexpected invasive component of an experiment is coercive: participants would have to choose to forfeit their expected compensation to opt out. They also might feel that they have been deceived by the experimenter.
In human subjects research, deception is a specific technical term that refers to cases when (1) experimenters withhold any information about its goals or intentions, (2) experimenters hide their true identity (such as when using actors), (3) some aspects of the research are under- or overstated to conceal information, or (4) participants receive any false or misleading information. Use of deception requires special consideration from a human subjects perspective (Kelman 2017; Baumrind 1985).
Even assuming they are disclosed properly without coercion or deception, the risks and benefits of a study must be assessed from the perspective of the participant, not the experimenter. By doing so, we allow participants to make an informed choice. In the case of the blood sample, the risks to the participant were not disclosed and the benefits were stated in terms of the research project (and the experimenter).
The benefits of participation in research can either be direct or indirect, and it is important to specify which type participants may receive. While some clinical studies and interventions may offer some direct benefit due to participation, many of the benefits of basic science research are indirect. Both have their place in science, but participants must ultimately determine the degree to which each type of benefit motivates their own involvement in a study (Shatz 1986).
12.1.1 Getting consent
Experimental participants must give consent. In most regulatory frameworks, there are clear guidelines about what the process of giving consent should look like. Typically participants are expected to read and sign a consent form: a document that explains the goals of the research and its procedures, describes potential risks and benefits, and asks for participants’ explicit consent to participate voluntarily. Table 12.1 gives the full list of consent form requirements from the US Office for Human Research Protections, and figure 12.1 shows how these individual requirements are reflected in a real consent form used in our research.
| Requirement | |
|---|---|
| 1 | A statement that the study involves research |
| 2 | An explanation of the purposes of the research |
| 3 | The expected duration of the subject’s participation |
| 4 | A description of the procedures to be followed |
| 5 | Identification of any procedures that are experimental |
| 6 | A description of any reasonably foreseeable risks or discomforts to the subject |
| 7 | A description of any benefits to the subject or to others that may reasonably be expected from the research |
| 8 | A disclosure of appropriate alternative procedures or courses of treatment, if any, that might be advantageous to the subject |
| 9 | A statement describing the extent, if any, to which confidentiality of records identifying the subject will be maintained |
| 10 | For research involving more than minimal risk, an explanation as to whether any compensation or medical treatments are available if injury occurs |
| 11 | An explanation of whom to contact for answers to pertinent questions about the research and research subjects’ rights |
| 12 | A statement that participation is voluntary, refusal to participate will involve no penalty, and that subject may discontinue participation at any time without penalty |
View the annotated consent form at full size in the source book.
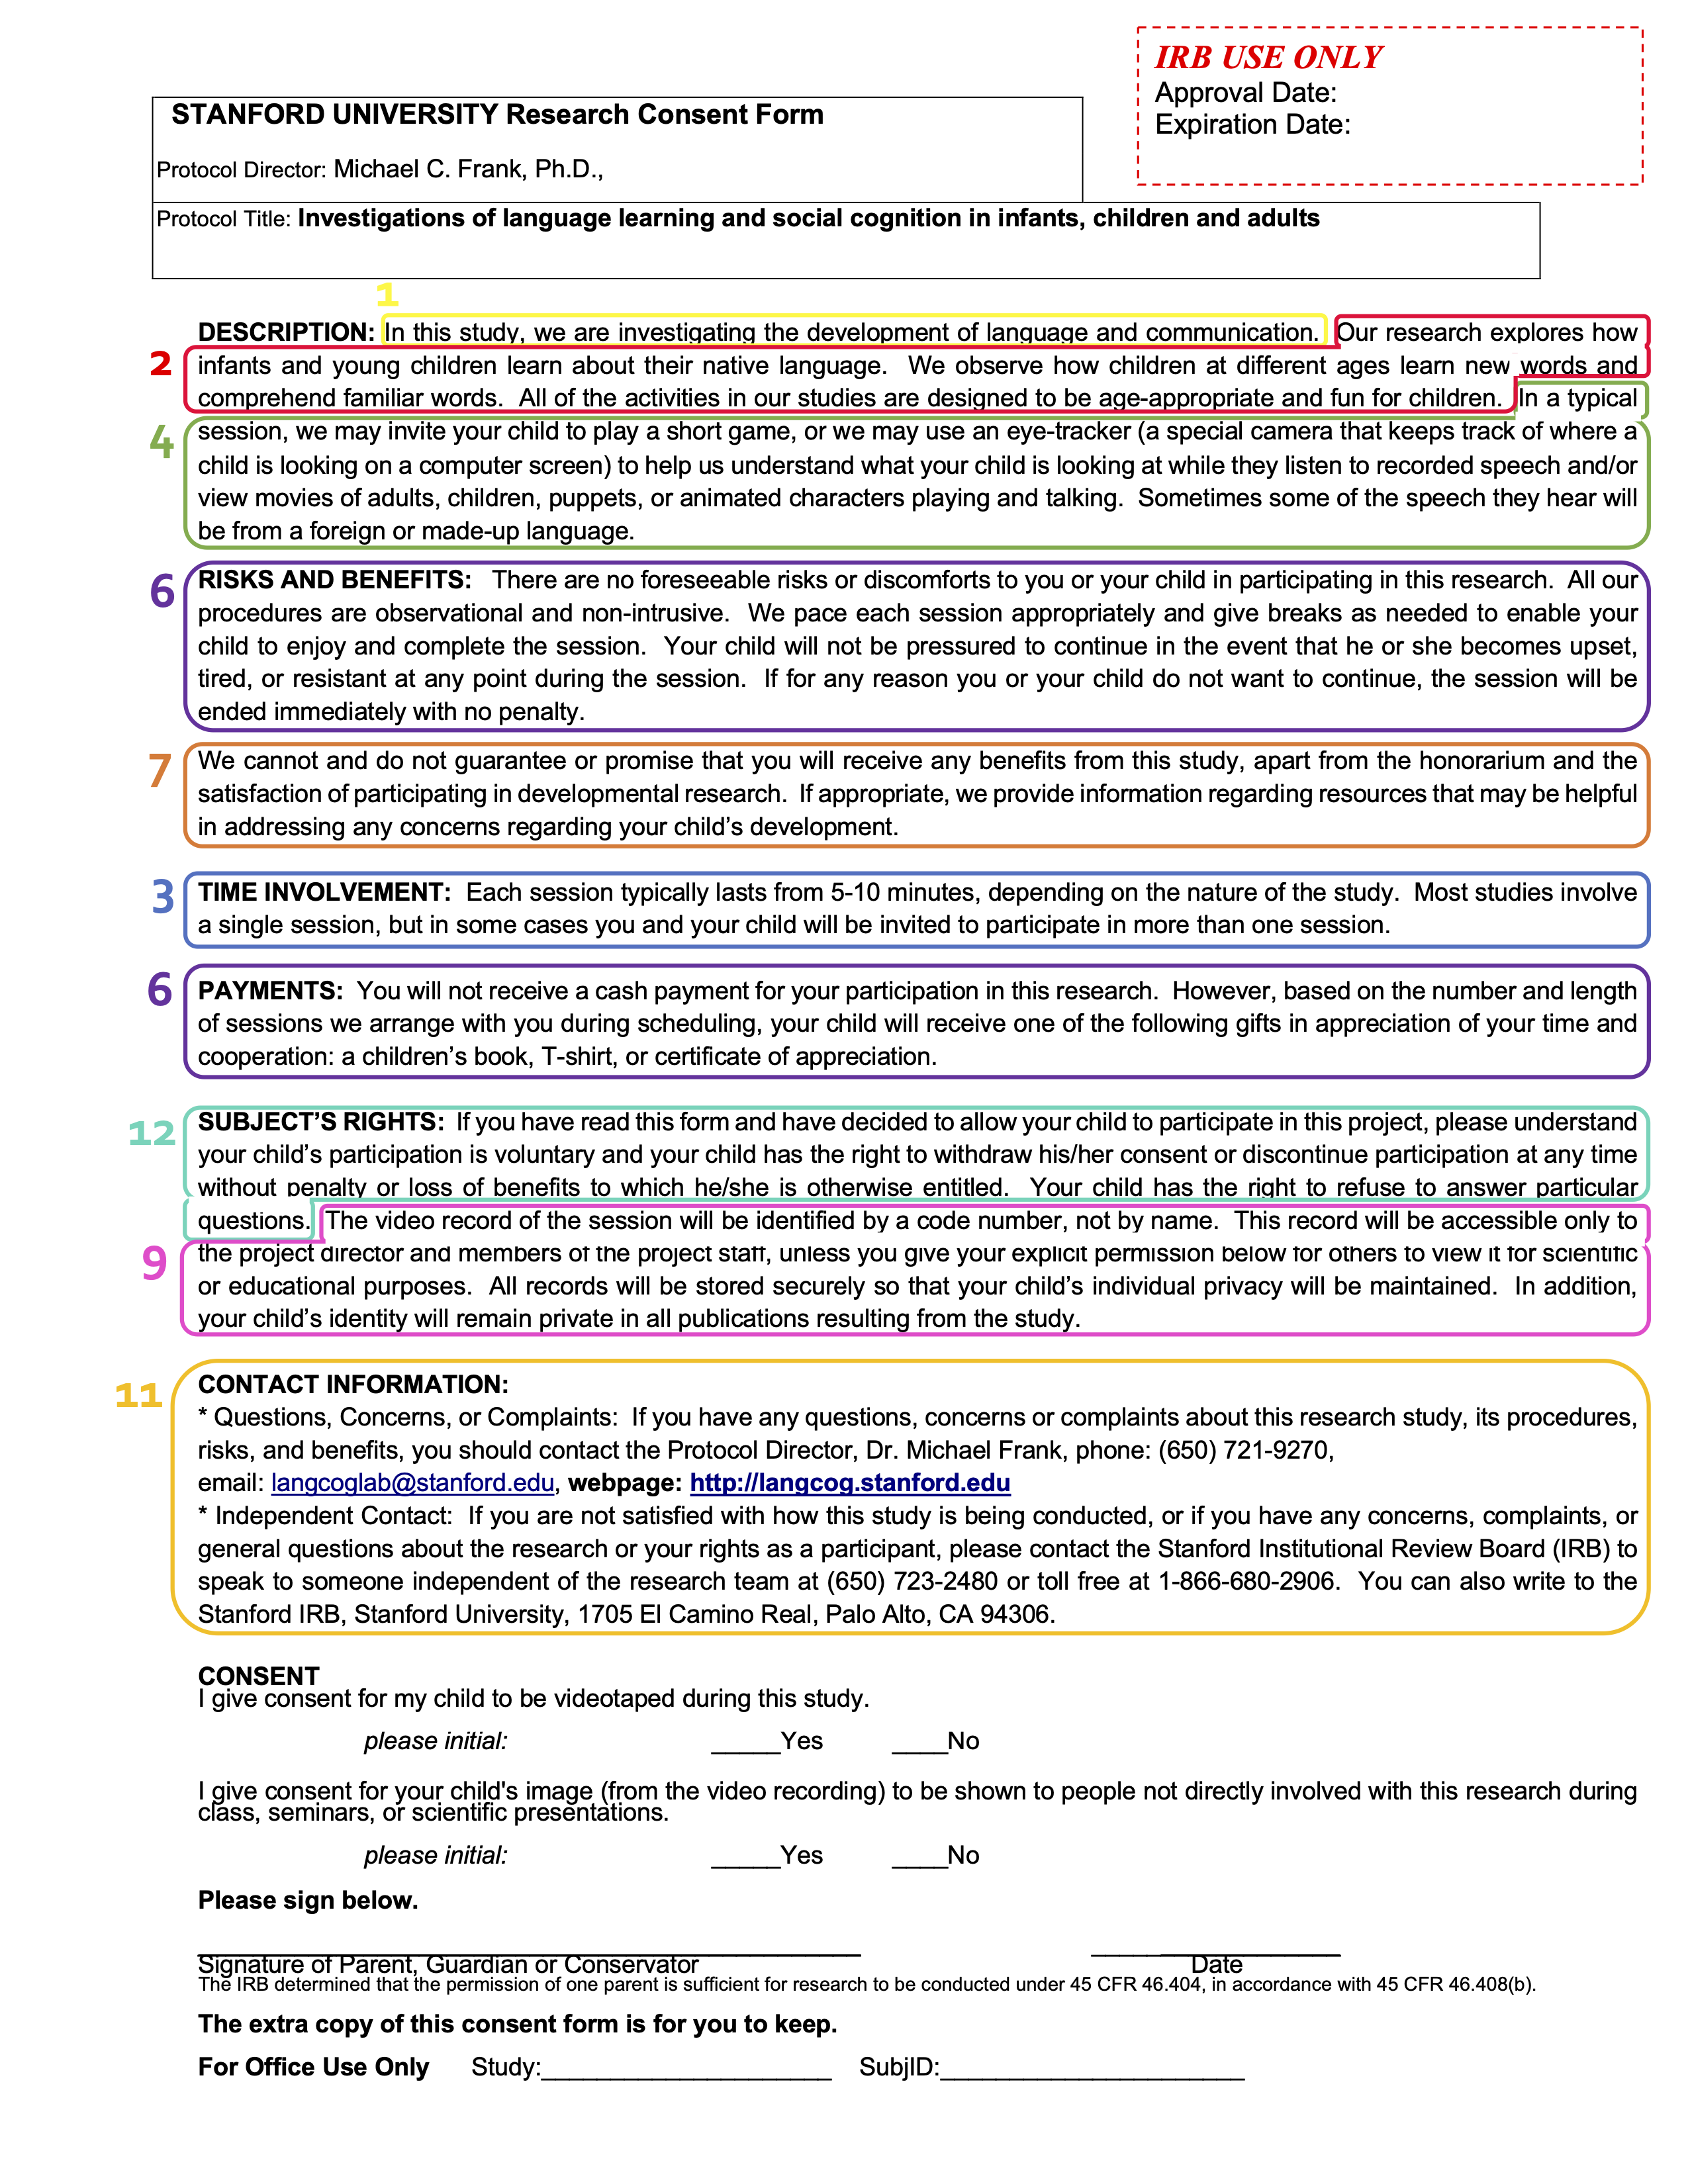
Since ethics regulation is almost always managed at the institutional level, your local ethics board will often provide guidance on the specific information you should include in the consent form and they will almost always need to approve the form before you are allowed to begin recruiting participants.
When providing consent information, researchers should focus on what someone might think or feel as a result of participating in the study. Are there any physical or emotional risks associated? What should someone know about the study that may give them pause about agreeing to participate in the first place? Our advice is to center the participant in the consent process rather than the research question. Information about specific research goals can typically be provided during debriefing.2
If there are specific pieces of information about study goals or procedures that must be withheld from participants during consent, deception of participants may be warranted. Deception can be approved by ethics boards as long as it poses little risk and is effectively addressed via more extensive debriefing. But an experimental protocol that includes deception will likely undergo greater scrutiny during ethics review, as it must be justified by a specific experimental need.
During the consent process, researchers should explain to participants what will be done with their data. Requirement 9 in table 12.1 asks for a statement about data confidentiality, but such a statement is a mere minimum. Some modern consent forms explicitly describe different uses of the data and ask for consent for each. For example, the form in figure 12.1 asks permission for showing recordings in presentations.3
12.1.2 Prerequisites of consent
To give consent, participants must have the cognitive capacity to make decisions (competence), understand what they are being asked to do (comprehension), and know that they have the right to withdraw consent at any time (voluntariness) (Kadam 2017).
Typically, we assume competence for adult volunteers in our experiments, but if we are working with children or other vulnerable populations (see below), we may need to consider whether they are legally competent to provide consent. Participants who cannot consent on their own should still be informed about participation in an experiment, and, if possible, you should still obtain their assent (informal agreement) to participate. When a person has no legal ability to consent, you must obtain consent from their legal guardian. But if they do not assent, you should also respect their decision not to participate—even if you previously obtained consent from their guardian.
The second prerequisite is comprehension. It is good practice to discuss consent forms verbally with participants, especially if the study is involved and takes place in person. If the study is online, ensure that participants know how to contact you if they have questions about the study. The consent form itself must be readable for a broad audience, meaning care should be taken to use accessible language and clear formatting. Consider giving participants a copy of the consent form in advance so they can read at their own pace, think of any questions they might have, and decide how to proceed without any chance of feeling coerced (Young et al. 1990).
Finally, participants must understand that their involvement is voluntary, meaning that they are under no obligation to be involved in a study and always have the right to withdraw at any time. Experimenters should not only state that participation is voluntary; they should also pay attention to other features of the study environment that might lead to structural coercion (Fisher 2013). For example, high levels of compensation can make it difficult for lower-income participants to withdraw from research. Similarly, factors like race, gender, and social class can lead participants to feel discomfort around discontinuing a study. It is incumbent on experimenters to provide a comfortable study environment and to avoid such coercive factors wherever possible.
12.1.3 Debriefing participants
Once a study is completed, researchers should always debrief participants. A debriefing is composed of four parts: (1) gratitude, (2) discussion of goals, (3) explanation of deception (if relevant), and (4) questions and clarification (Allen 2017). Together these serve to contextualize the experience for the participant and to mitigate any potential harms from the study.
Gratitude. Thank participants for their contribution! Sometimes thanks is enough (for a short experiment), but many studies also include monetary compensation or course credit. Compensation should be commensurate with the amount of time and effort required for participation. Compensation structures vary widely from place to place; typically local ethics boards will have specific guidelines.
Discussion of goals. Researchers should share the purpose of the research with participants in, aiming for a short and accessible statement that avoids technical jargon. Sharing goals is especially important when some aspect of the study appears evaluative—participants will often be interested in knowing how well they performed against their peers. For example, a parent whose child completed a word-recognition task may request information about their child’s performance. It can assuage parents’ worries to highlight that the goals of the study are about measuring a particular experimental effect, not about individual evaluation and ranking.4
Explanation of deception. Researchers must reveal any deception during debriefing, regardless of how minor the deception seems to the researcher. This component of the debriefing process can be thought of as “dehoaxing” because it is meant to illuminate any aspects of the study that were previously misleading or inaccurate (Holmes 1976). The goal is both to reveal the true intent of the study and to alleviate any potential anxiety associated with the deception. Experimenters should make clear both where in the study the deception occurred and why the deception was necessary for the study’s success.
Questions and clarification. Finally, researchers should answer any questions or address any concerns raised by participants. Many researchers use this opportunity to ask participants about their own ideas about the study goals. This practice not only illuminates aspects of the study design that may have been unclear to or hidden from participants, but also begins a discussion where both researchers and participants can communicate about this joint experience. This step is also helpful in identifying negative emotions or feelings resulting from the study (Allen 2017). When participants do express negative emotions, researchers are responsible for sharing resources participants can use to help them.5
12.2.2 Ensuring good experiences for online participants
The design challenges for online experiments are very different than for in-lab experiments. As the experimental procedure is delivered through a web browser, experimenter variability and potential expectancy effects are almost completely eliminated. On the other hand, some online participants do many hours of tasks a day and many are multi-tasking in other windows or on other devices. It can be much harder to induce interest and engagement in your research when your manipulation is one of dozens the participant has experienced that day and when your interactions are mediated by a small window on a computer screen.
When creating an online experimental experience, we consider four issues: (1) design, (2) communication, (3) payment policies, and (4) effective consent and debriefing.6
Basic UX design. Good experiment design online is a subset of good web user experience (UX) design more generally. If your web experiment is unpleasant to interact with, participants will likely become confused and frustrated. They will either drop out or provide data that are lower quality. A good interface should be clean and well-tested and should offer clear places where the participant must type or click to interact. If a participant presses a key at an appropriate time, the experiment should offer a response—otherwise the participant will likely press it again. If the participant is uncertain how many trials are left, they may be more likely to drop out of the experiment so it is also helpful to provide an indication of their progress. If they are performing a speeded paradigm, they should receive practice trials to ensure that they understand the experiment prior to beginning the critical blocks of trials.
Communication. Many online studies involve almost no direct contact with participants. When participants do communicate with you, it is very important to be responsive and polite (as it is with in-lab participants, of course). Unlike the typical undergraduate participant, the work that a crowdworker is doing for your study may be part of how they earn their livelihood, and a small issue in the study for you may feel very important for them. For that reason, rapid resolution of issues with studies—typically through appropriate compensation—is very important. Crowdworkers often track the reputation of specific labs and experimenters (sometimes through forums or specialized software; Irani and Silberman 2013). A quick and generous response to an issue will ensure that future crowdworkers do not avoid your studies.
Payment policies. Unclear or punitive payment policies can have a major impact on crowdworkers. We strongly recommend always paying workers if they complete your experiment, regardless of result. This policy is comparable to standard payment policies for in-lab work. We assume good faith in our participants: if someone comes to the lab, they are paid for the experiment, even if it turns out that they did not perform correctly. The major counterargument to this policy is that some online marketplaces have a population of workers who are looking to cheat by being noncompliant with the experiment (e.g., entering gibberish or even using scripts or artificial intelligence tools to progress quickly through studies). Our recommendation is to address this issue through the thoughtful use of “check” trials (see below)—not through punitive nonpayment. The easiest way for a participant to complete your experiment should be by complying with your instructions.
Consent and debriefing. Because online studies are typically fully automated, participants do not have a chance to interact with researchers around consent and debriefing. Further, engagement with long consent forms may be minimal. In our work, we have typically relied on short consent statements such as the one from our class that is shown in table 12.2. Similarly, debriefing often occurs through a set of pages that summarize all components of the debriefing process (participation gratitude, discussion of goals, explanation of deception if relevant, and questions and clarification). Because these interactions are so short, it is especially important to include contact information prominently so that participants can follow up.
| By answering the following questions, you are participating in a study being performed by cognitive scientists in the Stanford Department of Psychology. If you have questions about this research, please contact us at [CLASS EMAIL ADDRESS]. You must be at least 18 years old to participate. Your participation in this research is voluntary. You may decline to answer any or all of the following questions. You may decline further participation, at any time, without adverse consequences. Your anonymity is assured; the researchers who have requested your participation will not receive any personal information about you. |
12.3.1 Conduct effective pilot studies
A pilot study is a small study conducted before you collect your main sample. The goal is to ensure smooth and successful data collection by first checking if your experimental procedures and data collection workflow are working correctly. Pilot studies are also an opportunity to get feedback from participants about their experience of the experimental task; for example, if it is too easy, too difficult, or too boring.
Because pilot studies usually involve a small number of participants, they are not a reliable indicator of the study results, such as the expected effect size or statistical significance (as we discussed in chapter 10). Don’t use pilots to check if your effect is present or to estimate an effect size for power analysis. What pilots can tell you is whether your experimental procedure is viable. For example, pilots studies can reveal:
- if your code crashes under certain circumstances
- if your instructions confuse a substantial portion of participants
- if you have a very high dropout rate
- if your data collection procedure fails to log variables of interest
- if participants are disgruntled by the end of the experiment
We recommend that all experimenters perform—at the very minimum—two pilot studies before they launch a new experiment.7
The first pilot, which we call your non-naive participant pilot, can make use of participants who know the goals of the experiment and understand the experimental manipulation—this could be a friend, collaborator, colleague, or family member.8 The goal of this pilot study is to ensure that your experiment is comprehensible, that participants can complete it, and that the data are logged appropriately. You must analyze the data from the non-naive pilot, at least to the point of checking that the relevant data about each trial is logged.
The second pilot, your naive participant pilot, should consist of a test of a small set of participants recruited via the channel you plan to use for your main study. The number of participants you should pilot depends on the cost of the experiment in time, money, and opportunity as well as its novelty. A brand new paradigm is likely more prone to error than a tried and tested paradigm. For a short online survey-style experiment, a pilot of 10–20 people is reasonable. A more time-consuming laboratory study might require piloting just two or three people.9
The goal of the naive pilot study is to understand properties of the participant experience. Were participants confused? Did they withdraw before the study finished? Even a small number of pilots can tell you that your dropout rate is likely too high: for example, if five of ten pilot participants withdraw, you likely need to reconsider aspects of your design. It’s critical for your naive participant pilot that you debrief more extensively with your participants. This debriefing often takes the form of an interview questionnaire after the study is over. “What did you think the study was about?” and “Is there any way we could improve the experience of being in the study?” can be helpful questions. Often this debriefing is more effective if it is interactive, so even if you are running an online study you may want to find some way to chat with your participants.
Piloting—especially piloting with naive participants to optimize the participant experience—is typically an iterative process. We frequently launch an experiment for a naive pilot, then recognize from the data or from participant feedback that the experience can be improved. We make tweaks and pilot again. Be careful not to over-fit to small differences in pilot data, however. Piloting should be more like workshopping a manuscript to remove typos than doing statistical analysis. If someone has trouble understanding a particular sentence—whether in your manuscript or in your experiment instructions—you should edit to make it clearer!
12.3.2 Measure participant compliance
You’ve constructed your experiment and piloted it. You are almost ready to go—but there is one more family of tricks for helping to achieve high-quality data: integrating measures of participant compliance into your paradigm. Collecting data on compliance (whether participants followed the experimental procedures as expected) can help you quantify whether participants understood your task, engaged with your manipulation, and paid attention to the full experimental experience. These measures in turn can be used both to modify your experimental paradigm and to exclude specific participants that were especially noncompliant (Hauser et al. 2018; Ejelöv and Luke 2020).
Below we discuss four types of compliance checks: (1) passive measures, (2) comprehension checks, (3) manipulation checks, and (4) attention checks. Passive measures and comprehension checks are very helpful for enhancing data quality. Manipulation checks also often have a role to play. In contrast, we suggest caution regarding the use of attention checks.
Passive measures of compliance. Even if you do not ask participants anything extra in an experiment, it is often possible to tell if they have engaged with the experimental procedure simply by how long it takes them to complete the experiment. If you see participants with completion times substantially above or below the median, there is a good chance that they are either multi-tasking or rushing through the experiment without engaging.10 Passive measures cost little to implement and should be inserted whenever possible in experiments.11
Comprehension checks. For tasks with complex instructions or experimental materials (say a passage that must be understood for a judgment to be made about it), it can be very helpful to get a signal that participants have understood what they have read or viewed. Comprehension checks, which ask about the content of the experimental instructions or materials, are often included for this purpose. For the comprehension of instructions, the best kinds of questions simply query the knowledge necessary to succeed in the experiment: for example, “What are you supposed to do when you see a red circle flash on the screen?” In many platforms, it is possible to make participants reread the instructions again until they can answer these correctly. This kind of repetition is nice because it corrects participants’ misconceptions rather than allowing them to continue in the experiment when they do not understand.12
Manipulation checks. If your experiment involves more than a very transient manipulation—for example, if you plan to induce some state in participants or have them learn some content—then you can include a measure in your experiment that confirms that your manipulation succeeded (Ejelöv and Luke 2020). This measure is known as a manipulation check because it measures some prerequisite difference between conditions that is not the key causal effect of interest but is causally prerequisite to this effect. For example, if you want to see if anger affects moral judgment, then it makes sense to measure whether participants in your anger induction condition rate themselves as angrier than participants in your control condition. Manipulation checks are useful in the interpretation of experimental findings because they can decouple the failure of a manipulation from the failure of a manipulation to affect your specific measure of interest.13
Attention checks. A final type of compliance check is a check that participants are paying attention to the experiment at all. One simple technique is to add questions that have a known and fairly obvious right answer (e.g., “What’s the capital of the United States?”). These trials can catch participants that are simply ignoring all text and “mashing buttons,” but they will not find participants who are mildly inattentive. Sometimes experimenters also use trickier compliance checks, such as putting an instruction for participants to click a particular answer deep within a question text that otherwise would have a different answer (figure 12.2). Such compliance checks decrease so-called satisficing behavior, in which participants read as quickly as they can to get away with doing only the minimum. On the other hand, participants may see such trials as indications that the experimenter is trying to trick them, and adopt a more adversarial stance toward the experiment, which may result in less compliance with other aspects of the design, unless they are at the end of the experiment (Hauser et al. 2018). If you choose to include attention checks like these, be aware that you are likely reducing variability in your sample—trading off representativeness for compliance.

Data from all of these types of checks are used in many different—often inconsistent—ways in the literature. We recommend that you:
- Use passive measures and comprehension checks as preregistered exclusion criteria to eliminate a (hopefully small) group of participants who might be noncompliant with your experiment.
- Check that exclusions are low and are uniform across conditions. If exclusion rates are high, your design may have deeper issues. If exclusions are asymmetric across conditions, you may be compromising your randomization by creating a situation in which (on average) different kinds of participants are included in one condition compared with the other. Both of these situations substantially compromise any estimate of the causal effect of interest.
- Deploy manipulation checks if you are concerned about whether your manipulation effectively induces a difference between groups. Analyze the manipulation check separately from the dependent variable to test whether the manipulation was causally effective (Ejelöv and Luke 2020).
- Make sure that your attention checks are not confounded in any way with condition—remember our cautionary tale from chapter 9, in which an attention check that was different across conditions actually created an experimental effect.
- Do not include any of these checks in your analytic models as a covariate, as including this information in your analysis compromises the causal inference from randomization and introduces bias in your analysis (Montgomery et al. 2018).14
Used appropriately, compliance checks can provide both a useful set of exclusion criteria and a powerful tool for diagnosing and correcting potential issues with your experiment.
The next selections address sample size and when to stop collecting data.
10.4 Sample size planning
Source (opening paragraphs only)
Now that you have spent some time considering your sample and what population it represents, how many people will your sample contain? Continuing to collect data until you observe a in an inferential test is a good way to get a false positive. This practice, known as “optional stopping,” is a good example of a practice that invalidates -values, much like the cases of analytic flexibility discussed in chapter 3 and chapter 6.
Decisions about when to stop collecting data should not be data-dependent. Instead you should transparently declare your data collection stopping rule in your study preregistration (see chapter 11). This step will reassure readers that there is no risk of bias from optional stopping. The simplest stopping rule is, “I’ll collect data until I get to a target ”—all that’s needed in this case is a value for .
But how do you decide ? It’s going to be dependent on the effect that you want to measure and how it varies in the population. Smaller effects will require larger sample sizes. Classically, was computed using power analysis, which can provide a sample size for which you have a good chance of rejecting the null hypothesis (given a particular expected effect size). We’ll introduce this computation below.
Classical power analysis is not the only way to plan your sample size. There are a number of other useful strategies, some of which rely on the same kinds of computations as power analysis (table 10.1). Each of these can provide a valid justification for a particular sample size, but they are useful in different situations.
| Method | Stopping rule | Example |
|---|---|---|
| Power analysis | Stop at for known probability of rejecting the null given known effect size | Randomized trial with strong expectations about effect size |
| Resource constraint | Stop collecting data after a certain amount of time or after a certain amount of resources are used | Time-limited field work |
| Smallest effect size of interest | Stop at for known probability of rejecting the null for effects greater than some minimum | Measurement of a theoretically important effect with unknown magnitude |
| Precision analysis | Stop at that provides some known degree of precision in measure | Experimental measurement to compare with predictions of cognitive models |
| Sequential analysis | Stop when a known inferential criterion is reached | Intervention trial designed to accept or reject null with maximal efficiency |
10.4.1 Power analysis

Let’s start by reviewing the null-hypothesis significance testing paradigm that we introduced in chapter 6. Recall that we introduced the Neyman-Pearson decision-theoretic view of testing in chapter 6, shown again in figure 10.7. The idea was that we’ve got some null hypothesis and some alternative —something like “No effect” and “Yes, there is some effect with known size”—and we want to use data to decide which state we’re in. is our criterion for rejecting the null, conventionally set to .
But what if is actually false and the alternative is true? Not all experiments are equally well set up to reject the null in those cases. Imagine doing an experiment with . In that case, we’d almost always fail to reject the null, even if it were false. Our sample would almost certainly be too small to rule out sampling variation as the source of our observed data.
Let’s try to quantify our willingness to miss the effect—the false negative rate. We’ll denote this probability with . If is the probability of missing an effect (failing to reject the null when it’s really false), then is the probability that we correctly reject the null when it is false. That’s what we call the statistical power of the experiment.

We can only compute power if we know the effect size for the alternative hypothesis. If the alternative hypothesis is a small effect, then the probability of rejecting the null will typically be low (unless the sample size is very large). In contrast, if the alternative hypothesis is a large effect, then the probability of rejecting the null will be higher.
The same dynamic holds with sample size: the same effect size will be easier to detect with a larger sample size than a smaller one. Figure 10.8 shows how this relationship works. A large sample size creates a tighter null distribution (right side) by reducing sampling error. A tighter null distribution means you can reject the null more of the time based on the variation in a true effect. If your sample size is too small to detect your effect much of the time, we call this being underpowered.15
Classical power analysis involves computing the sample size
that’s necessary in order to achieve some level of power, given
and a known effect size.16 The mathematics of the
relationship between
,
,
,
and effect size have been worked out for a variety of different
statistical tests (Cohen
2013) and codified in software like G*Power (Faul et
al. 2007) and the pwr package for R (Champely
2020). For other cases (including mixed effects models), you may
have to conduct a simulation in which you generate many simulated
experimental runs under known assumptions and compute how many of these
lead to a significant effect; luckily, R packages exist for this purpose
as well, including the simr package (Green
and MacLeod 2016).
10.4.3 Alternative approaches to sample size planning
Let’s now consider some alternatives to classic power analysis that can still yield reasonable sample size justifications.
Resource constraint. In some cases, there are fundamental resource constraints that limit data collection. For example, if you are doing fieldwork, sometimes the right stopping criterion for data collection is “when the field visit is over,” since every additional datapoint is valuable. When prespecified, these kinds of sample size justifications can be quite reasonable, though they do not preclude being underpowered to test a particular hypothesis.
Smallest effect size of interest (SESOI). SESOI analysis is a variant on power analysis that includes some resource constraint planning. Instead of trying to intuit how big your target effect is, you instead choose a level below which you might not be interested in detecting the effect. This choice can be informed by theory (what is predicted), applied concerns (what sort of effect might be useful in a particular context), or resource constraints (how expensive or time-consuming it might be to run an experiment). In practice, SESOI analysis is simply a classic power analysis with a particular small effect as the target.
Precision-based sample planning. As we discussed in chapter 6, the goal of research is not always to reject the null hypothesis! Sometimes—we’d argue that it should be most of the time—the goal is to estimate a particular causal effect of interest with a high level of precision, since these estimates are a prerequisite for building theories. If what you want is an estimate with known precision (say, a confidence interval of a particular width), you can compute the sample size necessary to achieve that precision (Bland 2009; Rothman and Greenland 2018).17
Sequential analysis. Your stopping rule need not be a hard cutoff at a specific . Instead, it’s possible to plan a sequential analysis using either frequentist or Bayesian methods, in which you plan to stop collecting data once a particular inferential threshold is reached. For the frequentist version, the key thing that keeps sequential analysis from being -hacking is that you prespecify particular values of at which you will conduct tests and then correct your -values for having tested multiple times (Lakens 2014). For Bayesian sequential analysis, you can actually compute a running Bayes Factor as you collect data and stop when you reach a prespecified level of evidence (Schönbrodt et al. 2017). This latter alternative has the advantage of allowing you to collect evidence for the null as well as against it.18
In sum, there are many different ways of justifying your sample size or your stopping rule. The most important things are (1) to prespecify your strategy and (2) to give a clear justification for your choice. Table 10.2 gives an example sample size justification that draws on several different concepts discussed here, using classical power computations as one part of the justification. A reviewer could easily follow the logic of this discussion and form their own conclusion about whether this study had an adequate sample size and whether it should have been conducted given the researchers’ constraints.
| Element | Justification text |
|---|---|
| Background | We did not have strong prior information about the likely effect size, so we could not compute a classical power analysis. |
| Smallest effect of interest | Because of our interest in meaningful factors affecting word learning, we were interested in effect sizes as small as . |
| Resource limitation | We were also limited by our ability to collect data only at our on-campus preschool. |
| Power computation | We calculated that based on our maximal possible sample size of (60 per group), we would achieve at least 80% power to reject the null for effects as small as . |
The final selections cover preregistration and keeping data that can be understood and analyzed.
11.1 Lost in a garden of forking paths
One way to visualize researcher degrees of freedom is as a vast decision tree or “garden of forking paths” (figure 11.3). Each node represents a decision point, and each branch represents a justifiable choice. Each unique pathway through the garden terminates in an individual research outcome.

Because scientific observations typically consist of both noise (random variation unique to this sample) and signal (regularities that will reoccur in other samples), some of these pathways will inevitably lead to results that are misleading (e.g., inflated effect sizes, exaggerated evidence, or false positives). The more potential paths in the garden that you might explore, the higher the chance of encountering misleading results.
Statisticians refer to this issue as a multiplicity (multiple comparisons) problem. As we talked about in chapter 6, multiplicity can be addressed to some extent with statistical countermeasures such as the Bonferroni correction; however, these adjustment methods need to account for every path that you could have taken (Gelman and Loken 2014; de Groot 2014 [1956]). When you navigate the garden of forking paths while working with the data, it is easy to forget—or even be unaware of—every path that you could have taken, so these methods can no longer be used effectively.
The signal-to-noise ratio is worse in particular situations (as common in psychology) with small effect sizes, high variation, and large measurement errors (Ioannidis 2005). Researcher degrees of freedom may be constrained to some extent by strong theory (Oberauer and Lewandowsky 2019), community methodological norms, or replication studies, though these constraints may be more implicit than explicit, and can still leave plenty of room for flexible decision-making.
11.1.1 Data-dependent analysis
When a researcher navigates the garden of forking paths during data analysis, their choices might be influenced by the data (data-dependent decision-making), which can introduce bias. If a researcher is seeking a particular kind of result (see the Depth box below), then they are more likely to follow the branches that steer them in that direction.
You could think of this a bit like playing a game of “hot () or cold (),” where indicates that the choice will move the researcher closer to a desirable overall result and indicates that the choice will move them further away. Each time the researcher reaches a decision point, they try one of the branches and get feedback on how that choice affects the results. If the feedback is then they take that branch. If the answer is , they try a different branch. If they reach the end of a complete pathway, and the result is , maybe they even retrace their steps and try some different branches earlier in the pathway. This strategy creates a risk of bias because it systematically skews results toward the researcher’s preferences (Hardwicke and Wagenmakers 2023).19
In the most egregious cases, a researcher may try multiple pathways until they obtain a desirable result and then selectively report that result, neglecting to mention that they have tried several other analysis strategies (also known as -hacking, a practice we’ve discussed throughout the book).20 You may remember an example of this practice in chapter 3, where participants apparently became younger when they listened to “When I’m 64” by The Beatles. Another example of how damaging the garden of forking paths can be comes from the “discovery” of brain activity in a dead Atlantic Salmon (Bennett et al. 2009)! Researchers deliberately exploited flexibility in the fMRI analysis pipeline and avoided multiple comparisons corrections to find “brain activity” where there was only dead fish (figure 11.5).

11.1.2 Hypothesizing after results are known
In addition to degrees of freedom in experimental design and analysis, there is additional flexibility in how researchers interpret research results. As we discussed in chapter 2, theories can accommodate even conflicting results in many different ways—for example, by positing auxiliary hypotheses that explain why a particular datapoint is special.
The practice of selecting or developing your hypothesis after observing the data has been called “hypothesizing after the results are known,” or “HARKing” (Kerr 1998). HARKing is potentially problematic because it expands the garden of forking paths and helps to justify the use of various additional design and analysis decisions (figure 11.6). For example, you may come up with an explanation for why an intervention is effective in men but not in women in order to justify a post hoc subgroup analysis based on sex (see the Case study box).

The extent to which HARKing is problematic is contested (see Hardwicke and Wagenmakers 2023). At the very least, it’s important to be honest about whether hypotheses were developed before or after observing the data.
But hang on a minute! Isn’t it a good thing to seek out interesting results if they are there in the data? Shouldn’t we “let the data speak”? The answer is yes! But it’s crucial to understand the distinction between exploratory and confirmatory modes of research.21 Confirmation involves making research decisions before you’ve seen the data whereas exploration involves making research decisions after you’ve seen data.
The key things to remember about exploratory research are that you need to (1) be aware of the increased risk of bias arising from data-dependent decision-making and calibrate your confidence in the results accordingly; and (2) be honest with other researchers about your analysis strategy so they are also aware of the risk of bias and can calibrate their confidence in the outcomes accordingly. In the next section, we will learn about how preregistration helps us to make this important distinction between exploratory and confirmation research.
11.2 Reducing risk of bias, increasing transparency, and calibrating confidence with preregistration
You can counter the problem of researcher degrees of freedom and data-dependent decision-making by making research decisions before you have seen the data—like planning your route through the garden of forking paths before you start your journey (Wagenmakers et al. 2012; Hardwicke and Wagenmakers 2023). If you stick to the planned route, then you have eliminated the possibility that your decisions were influenced by the data.
Preregistration is the process of declaring your research decisions in a public registry before you analyze (and often before you collect) the data. Preregistration ensures that your research decisions are data-independent, which reduces risk of bias arising from the issues described above. Preregistration also transparently conveys to others what you planned, helping them to determine the risk of bias and calibrate their confidence in the research results. In other words, preregistration can dissuade researchers from engaging in questionable research practices like -hacking and HARKing, because they can be held accountable to their original plan while also providing the context needed to properly evaluate and interpret research.

Preregistration does not require that you specify all research decisions in advance, only that you are transparent about what was planned, and what was not planned. This transparency helps to make a distinction between which aspects of the research were exploratory and which were confirmatory (figure 11.7). All else being equal, we should have more confidence in confirmatory results, because there is a lower risk of bias. Exploratory results have a higher risk of bias, but they are also more sensitive to serendipitous (unexpected) discoveries. So the confirmatory mode is best suited to testing hypotheses, and the exploratory mode is best suited to generating them. Therefore, exploratory and confirmatory research are both valuable activities—it is just important to differentiate them (Tukey 1980)! Preregistration offers the best of both worlds by clearly separating one from the other.
In addition to the benefits described above, preregistration may improve the quality of research by encouraging closer attention to study planning. We’ve found that the process of writing a preregistration really helps facilitate communication between collaborators, and can catch addressable problems before time and resources are wasted on a poorly designed study. Detailed advanced planning can also create opportunities for useful community feedback, particularly in the context of registered reports (see the Depth box below), where dedicated peer reviewers will evaluate your study before it has even begun.
11.3 How to preregister
High-stakes studies such as medical trials must be preregistered (Dickersin and Rennie 2012). In 2005, a large international consortium of medical journals decided that they would not publish unregistered trials. The discipline of economics also has strong norms about study registration (see, e.g., https://www.socialscienceregistry.org). But preregistration is pretty new to psychology (Nosek et al. 2018), and there’s still no standard way of doing it—if you’re doing it, you’re already at the cutting edge!
We recommend using the Open Science Framework (OSF) as your registry. OSF is one of the most popular registries in psychology, and you can do lots of other useful things on the platform to make your research transparent, like sharing data, materials, analysis scripts, and preprints. On OSF, it’s possible to “register” any file you have uploaded. When you register a file, it creates a time-stamped, read-only copy, with a dedicated link. You can add this link to articles reporting your research.
| Question | |||
|---|---|---|---|
| 1 | Data collection. Have any data been collected for this study already? | ||
| 2 | Hypothesis. What’s the main question being asked or hypothesis being tested in this study? | ||
| 3 | Dependent variable. Describe the key dependent variable(s) specifying how they will be measured. | ||
| 4 | Conditions. Which conditions will participants be assigned to? | ||
| 5 | Analyses. Specify exactly which analyses you will conduct to examine the main question/hypothesis. | ||
| 6 | Outliers and Exclusions. Describe exactly how outliers will be defined and handled, and your precise rule(s) for excluding observations. | ||
| 7 | Sample Size. How many observations will be collected, or what will determine sample size? No need to justify decision, but be precise about exactly how the number will be determined. | ||
| 8 | Other. Anything else you would like to preregister (e.g., secondary analyses, variables collected for exploratory purposes, unusual analyses planned). |
One approach to preregistration is to write a protocol document that specifies the study rationale, aims or hypotheses, methods, and analysis plan, and register that document.22 OSF also has a collection of dedicated preregistration templates that you can use if you prefer. An outline of such a template is shown in table 11.1. These templates are often tailored to the needs of particular types of research. For example, there are templates for general quantitative psychology research (“PRP-QUANT”; Bosnjak et al. 2022), cognitive modeling (Crüwell and Evans 2021), and secondary data analysis (Akker et al. 2019).23
Once you’ve preregistered your plan, you just go off and run the study and report the results, right? Well hopefully … but things might not turn out to be that straightforward. It’s quite common to forget to include something in your plan or to have to depart from the plan due to something unexpected. Preregistration can actually be pretty hard in practice (Nosek et al. 2019).
Don’t worry though—remember that a key goal of preregistration is transparency to enable others to evaluate and interpret research results. If you decide to depart from your original plan and conduct data-dependent analyses, then this decision may increase the risk of bias. But if you communicate this decision transparently to your readers, they can appropriately calibrate their confidence in the results. You may even be able to run both the planned and unplanned analyses as a robustness check (see the Depth box) to evaluate the extent to which this particular choice impacts the results.
When you report your study, it is important to distinguish between what was planned and what was not. If you ran a lot of data-dependent analyses, then it might be worth having separate exploratory and confirmatory results sections. On the other hand, if you mainly stuck to your original plan, with only minor departures, then you could include a table (perhaps in an appendix) that outlines these changes (for example, see Supplementary Information A of Hardwicke et al. 2021).
13.1.1 Organizing your project
To the greatest extent possible, all files related to a project should be stored in the same project folder (with appropriate subfolders), and on the same storage provider. There are cases where this is impractical due to the limitations of different software packages. For example, in many cases, a team will manage its data and analysis code via GitHub but decide to write collaboratively using Google Docs, Overleaf, or another collaborative platform. (It can also be hard to ask all collaborators to use a version control system they are unfamiliar with.) In that case, the final paper should still be linked in some way to the project repository.24
Figure 13.3 shows an example project stored on the Open Science Framework. The top-level folder contains subfolders for analyses, materials, raw and processed data (kept separately). It also contains the paper manuscript and, critically, a README file in a text format that describes the project. A README is a great way to document any other metadata that the authors would like to be associated with the research products, for example a license, explained below.

There are many reasonable ways to organize the subfolders of a
research project, but the broad categories of materials, data, analysis,
and writing are typically present.25 In some projects—such
as those involving multiple experiments or complex data types—you may
have to adopt a more complex structure. In many of our projects, it’s
not uncommon to find paths like
/data/raw_data/exp1/demographics. The key principle is to
create a hierarchical structure in which subfolders uniquely identify
the part of the broader space of research products that are found inside
them—that is, /data/raw_data/exp1 contains all the raw data
from experiment 1, and /data/raw_data/exp1/demographics
contains all the raw demographics data from that particular
experiment.
12.3.3 Keep consistent data collection records
As an experimentalist, one of the worst feelings is to come back to
your data directory and see a group of data files,
run1.csv, run2.csv, run3.csv and
not know what experimental protocol was run for each. Was
run1 the pilot? Maybe a little bit of personal archaeology
with timestamps and version history can tell you the answer, but there
is no guarantee.26
As well as collecting the actual data in whatever form they take (e.g., paper surveys, videos, or files on a computer), it is important to log metadata—data about your data—including relevant information like the date of data collection, the sample that was collected, the experiment version, and the research assistants who were present. The relevant metadata will vary substantially from study to study—the important part is that you keep detailed records. Figures 12.3 and 12.4 give two examples from our own research. The key feature is that they provide some persistent metadata about how the experiments were conducted.

%%%%%%%%%%%%%%%%%%%%%%%%%%%%%%%%%%%%%%%%%%%%%%%%%%%%%%%%%%%%%%%%%%%%%
Added a simple familiarization slide substitute that presents Bob and
shows that the experiment is about a person talking to you. Before
that, the familiarization slide was simply skipped.
%%%%%%%%%%%%%%%%%%%%%%%%%%%%%%%%%%%%%%%%%%%%%%%%%%%%%%%%%%%%%%%%%%%%%
----------------------------
November 18 2013
50 subjects | Betting | No familiarization | Friend
var participant_response_type = 1;
var participant_feature_count = 1;
var linguistic_framing = 0;
var question_type = 0;
----------------------------
November 18 2013
50 subjects | Likert | No familiarization | Friend
var participant_response_type = 2;
var participant_feature_count = 1;
var linguistic_framing = 0;
var question_type = 2;
%%%%%%%%%%%%%%%%%%%%%%%%%%%%%%%%%%%%%%%%%%%%%%%%%%%%%%%%%%%%%%%%%%%%%
The experiment now asked the subjects the referent of Bobs statement
at the bottom of the page. The previous experiments always had the
input field just below the stimuli or, in the case of 3fc hoovering
over the images did highlighted possible ones.
%%%%%%%%%%%%%%%%%%%%%%%%%%%%%%%%%%%%%%%%%%%%%%%%%%%%%%%%%%%%%%%%%%%%%
----------------------------
November 30 2013 ~ 7 pm:
50 subjects | 3 forced choice condition | No familiarization | Friend
var participant_response_type = 0;
var participant_feature_count = 1;
var linguistic_framing = 0;
var question_type = 0;13.2.1 Save your raw data
Raw data take many forms. For many of us, the raw data are those returned by the experimental software; for others, the raw data are videos of the experiment being carried out. Regardless of the form of these data, save them! They are often the only way to check issues in whatever processing pipeline brings these data from their initial state to the form you analyze. They also can be invaluable for addressing critiques or questions about your methods or results later in the process. If you need to correct something about your raw data, do not alter the original files. Make a copy, and make a note about how the copy differs from the original.27
Raw data are often not anonymized, or even anonymizable. Anonymizing them sometimes means altering them (e.g., in the case of downloaded logs from a service that might include IDs or IP addresses). Or in some cases, anonymization is difficult or impossible without significant effort and loss of some value from the data, for example, for video data or MRI data (Bischoff-Grethe et al. 2007). Unless you have specific permission for broad distribution of these identifiable data, the raw data may then need to be stored in a different way. In these cases, we recommend saving your raw data in a separate repository with the appropriate permissions. For example, in the ManyBabies 1 study we described above, the public repository does not contain the raw data contributed by participating labs, which the team could not guarantee was anonymized; these data are instead stored in a private repository.28
You can use your repository’s README to describe what is and is not shared. For example, a README might state, “We provide anonymized versions of the files originally downloaded from Qualtrics” or “Participants did not provide permission for public distribution of raw video recordings, which are retained on a secure university server.” Critically, if you share the derived tabular data, it should still be possible to reproduce the analytic results in your paper, even if checking the provenance of those numbers from the raw data is not possible for every reader.29
One common practice is the use of participant identifiers to link specific experimental data—which, if they are responses on standardized measures, rarely pose a significant identifiability risk—to demographic data sheets that might include more sensitive and potentially identifiable data.30 Depending on the nature of the analyses being reported, the experimental data can then be shared with limited risk. Then a selected set of demographic variables—for example, those that do not increase privacy risks but are necessary for particular analyses—can be distributed as a separate file and joined back into the data later.
13.2.2 Document your data collection process
To understand the meaning of the raw data, it’s helpful to share as much as possible about the context in which they were collected. This practice also helps communicate the experience that participants had in your experiment. Documentation of this experience can take many forms.
If the experimental experience was a web-based questionnaire, archiving this experience can be as simple as downloading the questionnaire source.31 For more involved studies, it can be more difficult to reconstruct what participants went through. This kind of situation is where video data can shine (Gilmore and Adolph 2017). A video recording of a typical experimental session can provide a valuable tutorial for other experimenters—as well as good context for readers of your paper. This is doubly true if there is a substantial interactive element to your experimental experience, as is often the case for experiments with children. For example, in our ManyBabies case study, the project shared “walk-through” videos of experimental sessions for many of the participating labs, creating a repository of standard experiences for infant development studies. If nothing else, a video of an experimental session can sometimes be a very nice archive of a particular context.32
Regardless of what specific documentation you keep, it’s critical to
create some record linking your data to the documentation. For a
questionnaire study, for example, this documentation might be as simple
as a README that says that the data in the data/raw/
directory were collected on a particular date using the file named
experiment1.qsf. This kind of “connective tissue” linking
data to materials can be very important when you return to a project
with questions. If you spot a potential error in your data, you will
want to be able to examine the precise version of the materials that you
used to gather those data in order to identify the source of the
problem.
13.2.3 Organize your data for later analysis: Spreadsheets
Data come in many forms, but chances are that at some point during your project you will end up with a spreadsheet full of information. Well-organized spreadsheets can mean the difference between project success and failure! A wonderful article by Broman and Woo (2018) lays out principles of good spreadsheet design. We highlight some of their principles here (with our own, opinionated ordering):
- Make it a rectangle.33 Nearly all data analysis software, like SPSS, Stata, Jamovi, and JASP (and many R packages), require data to be in a tabular format.34 If you are used to analyzing data exclusively in a spreadsheet, this kind of tabular data isn’t quite as readable, but readable formatting gets in the way of almost any analysis you want to do. Figure 13.5 gives some examples of nonrectangular spreadsheets. All of these will cause any analytic package to choke because of inconsistencies in how rows and columns are used!

- Choose good names for your variables. No one convention for
name formatting is best, but it’s important to be consistent. We tend to
follow the tidyverse style
guide and use lowercase words separated by underscores
(
_). It’s also helpful to give units where these are available—for example, whether reaction times are in seconds or milliseconds. Table 13.1 gives some examples of good and bad variable names.
Be consistent with your cell formatting. Each column should have one kind of thing in it. For example, if you have a column of numerical values, don’t all of a sudden introduce text data like “missing” into one of the cells. This kind of mixing of data types can cause havoc down the road. Mixed or multiple entries also don’t work, so don’t write “0 (missing)” as the value of a cell. Leaving cells blank is also risky because it is ambiguous. Most software packages have a standard value for missing data (e.g.,
NAis what R uses). If you are writing dates, please be sure to use the “global standard” (ISO 8601), which is YYYY-MM-DD. Anything else can be misinterpreted easily.35Decoration isn’t data. Decorating your data with bold headings or highlighting may seem useful for humans, but it isn’t uniformly interpreted or even recognized by analysis software (e.g., reading an Excel spreadsheet into R will scrub all your beautiful highlighting and artistic fonts), so do not rely on it.
Save data in plain text files. The CSV (comma-delimited) file format is a common standard for data that is uniformly understood by most analysis software (it is an “interoperable” file format).36 The advantage of CSVs is that they are not proprietary to Microsoft or another company and can be inspected in a text editor, but be careful: they do not preserve Excel formulas or formatting!
Given the points above, we recommend that you avoid analyzing your data in Excel. If it is necessary to analyze your data in a spreadsheet program, we urge you to save the raw data as a separate CSV and then create a distinct analysis spreadsheet so as to be sure to retain the raw data unaltered by your (or Excel’s) manipulations.
13.2.5 Document the format of your data
Even the best-organized tabular data are not always easy to understand by other researchers, or even yourself, especially after some time has passed. As such, you should make a codebook (also known as a data dictionary) that explicitly documents what each variable is. Figure 13.7 shows an example codebook for the trial-level data in the bottom of figure 13.6. Each row represents one variable in the associated dataset. Codebooks often describe what type of variable a column is (e.g., numeric, string), and what values can appear in that column. A human-readable explanation is often given as well, providing units (e.g., “seconds”) and a translation of numeric codes (e.g., “test condition is coded as 1”).
Creating a codebook need not require a lot of work. Almost any
documentation is better than nothing! There are also several R packages
that can automatically generate a codebook for you, for example
codebook (Arslan
2019), dataspice (Boettiger
et al. 2021), and dataMaid (Petersen
and Ekstrøm 2019). Adding a codebook can substantially increase the
reuse value of data and prevent hours of frustration as future you and
others try to decode your variable names and assumptions.


15.2.6 Visualization as debugging
The point of exploratory visualization is to converge toward a better
understanding of what’s going on in your data. As you iterate through
different exploratory visualizations, stay vigilant! Think
about what you expect to see before making the plot, then ask yourself
whether you got what you expected. You can think of this workflow as a
form of “visual debugging.” You might notice a data point with an
impossible value, such as a proportion greater than one or a reaction
time less than zero. Or you might notice weird clusters or striations,
which might indicate heterogeneity in data entry (perhaps different
coders used slightly different rubrics or rounded in different ways).
You might notice that an attribute is missing for some values and trace
it back to a bug reading in the data or merging data frames (maybe there
was a missing comma in our csv file). If you see anything
that looks weird, track it down until you understand why it’s happening.
Bugs that are subtle and invisible in other parts of the analysis
pipeline will often pop out as red flags in visualizations.
Source and selection
Selected and rearranged passages from Michael C. Frank, Mika Braginsky, Julie Cachia, Nicholas A. Coles, Tom E. Hardwicke, Robert D. Hawkins, Maya B. Mathur, and Rondeline Williams (2025), Experimentology: An Open Science Approach to Experimental Psychology Methods. Stanford University. Book and citation. Also published by MIT Press.
The source book is licensed under Creative Commons Attribution-NonCommercial 4.0 International. The book’s wording, section numbers, citations, and figure captions are retained. Sections have been rearranged; boxed digressions have been omitted; R code boxes are retained with the output of running them; margin notes appear as numbered footnotes; figures have been reduced. The annotated consent form is linked at full size. References to omitted material lead to the complete book. Source accessed November 5, 2026. This is an unofficial selection, not an author-approved edition.
The local control of ethics boards can lead to very different practices in ethical review across institutions, which is obviously inconsistent with the idea that ethical standards should be uniform! In addition, critics have wondered about the structural issue that institutional ethics boards have an incentive to decrease liability for the institution, while private boards have an incentive to provide approvals to the researchers who pay them (Lemmens and Freedman 2000).↩︎
Some experimenters worry that informing participants about the study that they are about to participate in may influence their behavior in the study via so-called demand characteristics, discussed in chapter 9. But the goal of a consent form is not to explain the specific psychological construct being manipulated. Instead, a consent form typically focuses on the experience of being in the study (for example, that a participant would be asked to provide quick verbal responses to pictures). This sort of general explanation should not create demand characteristics.↩︎
Some ethics boards will ask for consent for sharing even anonymized data files. As we discuss in chapter 13, fully anonymized data can often be shared without explicit consent. You may still choose to ask participants’ permission, but this practice may lead to an awkward situation—for example, a dataset with heterogeneous sharing permissions such that most but not all data can be shared publicly. Norms around anonymized data sharing are shifting, so it’s worth having a conversation with your ethics board about how they interpret your particular regulatory obligations.↩︎
At the study’s conclusion, you might also consider sharing any findings with participants—many participants appreciate learning about research findings that they contributed to, even months or years after participation.↩︎
In situations where participants report substantial concerns or negative reactions to an experiment—during debriefing or otherwise—researchers typically have an obligation to report these to their ethics board.↩︎
For extensive further guidance on this topic, see Litman and Robinson (2020).↩︎
We mean especially when deploying a new experimental paradigm or when collecting data from a new population. Once you have run many studies with a similar procedure and similar sample, extensive piloting is less important. Any time you change something, it’s always good to run one or two pilots, though, just to check that you didn’t inadvertently mess up your experiment.↩︎
In a pinch you can even run yourself through the experiment a bunch of times (though this isn’t preferable because you’re likely to miss a lot of aspects of the experience that you are habituated to, especially if you’ve been debugging the experiment already).↩︎
In the case of especially expensive experiments, it can be a dilemma whether to run a larger pilot to identify difficulties since such a pilot will be costly. In these cases, one possibility is to plan to include the pilot participants in the main dataset if no major procedural changes are required. In this case, it is helpful to preregister a contingent testing strategy to avoid introducing data-dependent bias (see chapter 11). For example, in a planned sample of 100 participants, you could preregister running 20 as a pilot sample with the stipulation that you will look only at their dropout rate—and not at any condition differences. Then the preregistration can state that, if the dropout rate is lower than 25%, you will collect the next 80 participants and analyze the whole dataset, including the initial pilot, but if dropout rate is higher than 25%, you will discard the pilot sample and make changes. This strategy can help you split the difference between cautious piloting and conservation of rare or costly data.↩︎
Measurements of per-page or per-element completion times can be even more specific since they can, for example, identify participants that simply did not read an assigned passage.↩︎
One variation that we endorse in certain cases is to force participants to engage with particular pages for a certain amount of time through the use of timers. Though, beware, this kind of feature can lead to an adversarial relationship with participants—in the face of this kind of coercion, many will opt to pull out their phone and multi-task until the timer runs down.↩︎
If you are querying comprehension of experimental materials rather than instructions, you may not want to reexpose participants to the same passage again in order to avoid confounding a participants’ initial comprehension and the amount of exposure that they receive.↩︎
Hauser et al. (2018) worry that manipulation checks can themselves change the effect of a manipulation—this worry strikes us as sensible, especially for some types of manipulations like emotion inductions. Their recommendation is to test the efficacy of the manipulation in a separate study, rather than trying to nest the manipulation check within the main study.↩︎
Including this information means you are “conditioning on a post-treatment variable,” as we described in chapter 7. In medicine, analysts distinguish “intent-to-treat” analysis, where you analyze data from everyone you gave a drug, and “as-treated” analysis, where you analyze data depending on how much of the drug people actually took. In general, intent-to-treat analysis gives the generalizable causal estimate. In our current situation, if you include compliance as a covariate, your estimate can be biased as a result. If you want to conduct an as-treated analysis, you should read up on how to perform and interpret this specific analysis.↩︎
You can also refer to a design as overpowered, though we object slightly to this characterization, since the value of large datasets is typically not just to reject the null but also to measure an effect with high precision and to investigate how it is moderated by other characteristics of the sample.↩︎
Our focus here is on giving you a conceptual introduction to power analysis, but we refer you to Cohen (1992) for a more detailed introduction.↩︎
In our experience, this kind of planning is most useful when you are attempting to gather measurements with sufficient precision to compare between computational models. Since the models can make quantitative predictions that differ by some known amount, then it’s clear how tight your confidence intervals need to be.↩︎
Another interesting variant is sequential parameter estimation, in which you collect data until a desired level of precision is achieved (Kelley et al. 2018); this approach combines some of the benefits of both precision-based analysis and sequential analysis.↩︎
We say “risk of bias” rather than just “bias” because in most scientific contexts, we do not have a known ground truth to compare the results to. So in any specific situation, we do not know the extent to which data-dependent decisions have actually biased the results.↩︎
“If you torture the data long enough, it will confess” (Good 1972, 14, quoting Ronald H. Coase).↩︎
In practice, an individual study may contain both exploratory and confirmatory aspects, which is why we describe them as different “modes.”↩︎
You can think of a study protocol as a bit like a research paper without a results and discussion section (here’s an example from one of our own studies: https://osf.io/2cnkq).↩︎
The OSF interface may change, but currently this guide takes you through the set of steps to create a preregistration: https://help.osf.io/article/158-create-a-preregistration.↩︎
The biggest issue that comes up in using a split workflow like this is the need to ensure reproducible written products, a process we cover in chapter 14.↩︎
We like the scheme followed by Project TIER (https://www.projecttier.org), which provides very clear guidance about file structure and naming conventions. TIER is primarily designed for a copy-and-paste workflow, which is slightly different from the “dynamic documents” workflow that we primarily advocate for (e.g., using R Markdown or Quarto as in appendix C).↩︎
We’ll have a lot to say about this issue in chapter 13.↩︎
Future you will thank present you for explaining why there are two copies of subject 19’s data after you went back and corrected a typo.↩︎
The precise repository you use for this task is likely to vary depending on the kind of data that you’re trying to store and the local regulatory environment. For example, in the United States, to store de-anonymized data with certain fields requires a server that is certified for HIPAA (the relevant privacy law). Many—but by no means all—universities provide HIPAA-compliant cloud storage.↩︎
One way we organize the raw data in some of our paper is to have three different subfolders in the
data/directory:raw/, for the original data;processed/, for the anonymized or otherwise preprocessed data; and/scripts, for the code that does the preprocessing. Since these folders are in a Git repository, we can then addraw/*to the.gitignorefile, ensuring that they are never added to the public version of the repository even though they sit within our local file hierarchy in the appropriate place.↩︎A word about subject identifiers. These should be anonymous identifiers, like randomly generated numbers, that cannot be linked to participant identities (like date of birth) and are unique. You laugh, but one of us was in a lab where all the subject IDs were the date of test and the initials of the participant. These were neither unique nor anonymous. One common convention is to give your study a code-name and to number participants sequentially, so your first participant in a sequence of experiments on information processing might be
INFO-1-01.↩︎If it’s in a proprietary format like a Qualtrics
.QSFfile, a good practice is to convert it to a simple plain text format as well so it can be opened and reused by folks who do not have access to Qualtrics (which may include future you!).↩︎Videos of experimental sessions also are great demos to show in a presentation about your experiment, provided you have permission from the participant.↩︎
Think of your data like a well-ordered plate of sushi, neatly packed together without any gaps.↩︎
Tabular data is a precursor to “tidy” data, which we describe in more detail in appendix D.↩︎
Dates in Excel deserve special mention as a source of terribleness. Excel has an unfortunate habit of interpreting information that has nothing to do with dates as dates, destroying the original content in the process. Excel’s issue with dates has caused unending horror in the genetics literature, where gene names are automatically converted to dates, sometimes without the researchers noticing (Ziemann et al. 2016). In fact, some gene names have had to be changed in order to avoid this issue!↩︎
Be aware of some interesting differences in how these files are output by European vs American versions of Microsoft Excel! You might find semicolons instead of commas in some datasets.↩︎